Purpose
PingER (Ping End-to-end Reporting) is the name given to the Internet End-to-end Performance Measurement (IEPM) project to monitor end-to-end performance of Internet links. The project now involves hundreds of sites in many countries all over the world and we are actively seeking new partners for this project.
- Brochure, Examples of Use, Publication, Tutorial , What is PingER (from ICTP/Trieste), Submission to Silicon Valley TechAwards 2012.
Examples of Use
See here.
Case Studies
PingER Validation
- Development Indices and PingER
- Derived Throughput
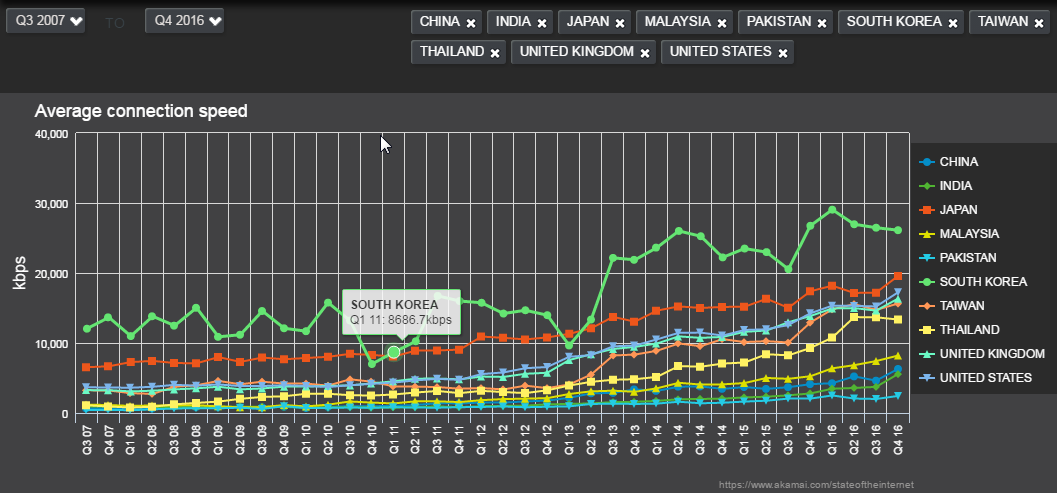
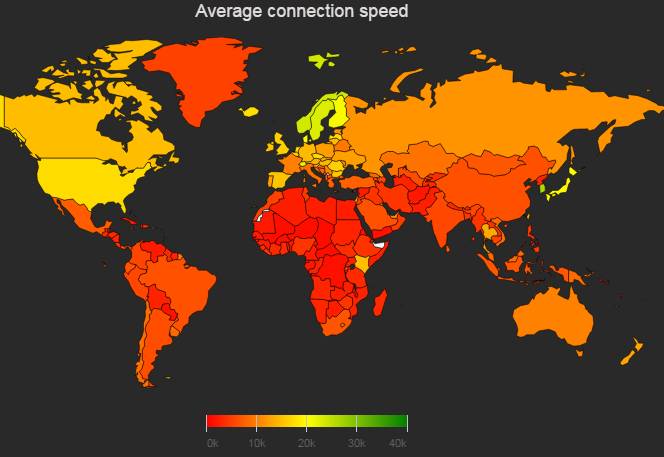
- Also see https://www.akamai.com/us/en/our-thinking/state-of-the-internet-report/state-of-the-internet-connectivity-visualization.jsp which goes back quarter by quarter to 2007 with Akamai download speeds by country with a linear y scale. The full report is at: https://content.akamai.com/pg8228-q4-2016-soti-connectivity-report.html
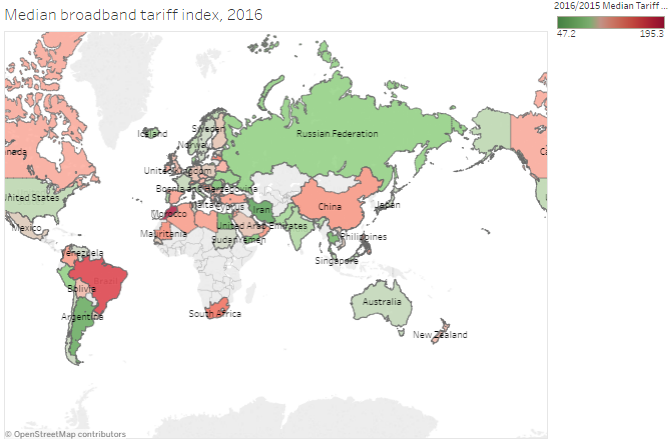
- Broadband tariffs see here
PingER Analysis
- PingER data Analysis
- Monitoring Data Format
- Anomalous Hosts
- CERN View
- Conditional Port Probability
- Duplicate Packets
- MOS
- Derivation of Directness of Connection
PingER Operations
- Downloading Pinger
- Requirements for Monitoring Host, Requirements for Remote Host
- Data: Meta database (NODEDETAILS), NODEDETAILS hints, NODEDETAILS schema, NODEDETAILS in Perl, NODETAILS in XML, Raw Data Format; Adding a new node to NODEDETAILS .
- PingER FAQ
- Management:
- Mapping of file space
- Choice of PingER packet size
- Pakistani hosts with new PingER2 to not lose <BeaconList> March 2012.
PingER Deployment
- PingER deployment 2008
- Shockwave Map, Google Map, Node count Intensity map, Node count GeoMap, Interactive Java Map (VIPER)
- Beacons , Beacon Expansion
- Monitoring Hosts, Remote Hosts
- Regions, Hosts per Country by Region
- Status of Pakistani monitoring hosts
- South East Asian Hosts (from UNIMAS)
- History of PingER Deployment
- Finding PingER remote hosts
- PingER at DESY
PingER Databases
Report on converting PingER flat files to a SQL database, Ghulam Nabi, M. Farhan Maqsoos, Bilal Naseer.
- NODEDETAILS
- Countries and Regions
- Database Passwords
- Database Synchronization
- PingER-DB Implementation details
- PingER Schema Queries
- PingER DB usage
- Comparison of the speed of the new perfSONAR schema database versus the old flat files
PingER Data
Toolbox
- Add new metrics to PingER
- PingER Data Explorer
- PingER Host Searcher
- PingER Route Visualizer
- PingER Visualization(VIPER)
- PingER Smokeping Integration
- PingER Metrics Motion Chart
- PingER Metrics Intensity Maps
- PingER Node Count Intensity & GeoMaps
- PingER Monitored Node Status
- Deploying table.pl
- Updating ping_data.pl and traceroute.pl
Porting PingER Archive to NUST
- PingER Meta-Database
- Web interface to manage the PingER Meta-Database
- Synchronization of the SLAC and NUST databases
- Scripts for fetching data from monitoring sites and pinger management
- Analysis and Implementation of Relational Archive Site for PingER and CBG Integration with TULIP
- Pinger Archive Site
PingER2
Installation
http://www.rnoc.gatech.edu/pinger2/, also Johari has created a shell script to automate the installation of pinger package in Ubuntu/Fedora/Centos Linux distro. The finalized installation script for pinger software for CentOS/Fedora based distribution is available from the following url (past the step by step tutorial): http://pinger.unimas.my/pinger/install-tutorial.php. Kashif assisted in testing the script.
http://confluence.slac.stanford.edu/display/IEPM/PingER2+at+SLAC
Raja Asad Khan, October 2012
PingER2 Data Flow & Access
Work in Progress
- Automating the creation of offsite.nodes directly from nodedetails.
- Automating the creation of beacons.txt directly from nodedetails.
- Document procedures for editing existing nodes.
ePingER
This is a project to provide low cost, low power PingER monitoring or remote stations.
PingER Futures
TULIP
Tulip Web Site
Old TULIP Web site
Tulip-CBG project report, by Ghulam Nabi, M. Farhan, Maqsood, Buialal Naseer, 2011
TULIP Analysis of alpha as a function of RTT and Region for Europe, North America and Pakistan, by Raja Asad Khan, October 2012.
Discussion on using International gateways to provide alpha between regions.
- AIG Paper Changes
- Automated PerfSONAR Landmark finding
- Target Data using reflector with Tier All
- TULIP: Data Flow
- TULIP2
- TULIP AIG with water exclusion
- TULIP Algorithm Alternative Trilateration Method
- TULIP Algorithm Apollonius Technique and its Performance
- TULIP Algorithm CBG with Apollonius
- TULIP Algorithm Multilateration
- TULIP Algorithm Trilateration
- TULIP Algorithm Trilateration with CBG
- TULIP Algorithm with Multilateration
- TULIP Alpha Determination
- TULIP Alpha Distributions
- TULIP Alpha Variability
- TULIP Analysis
- TULIP and UNDNS
- TULIP CAIDA RTT vs Distance Results
- TULIP Calculating distance from latitude and longitude
- TULIP Central Reflector
- TULIP Comparing geolocation techniques
- TULIP comparison of geolocation with database based approaches
- TULIP Correlation Between RTT and Distance
- TULIP Creating the Landmark XML files
- TULIP database Adding or Updating Landmarks
- TULIP database backup
- TULIP database through a GUI
- TULIP Distance Calculation based on RTT
- TULIP Distance Error (Apollonius) based on Alpha
- TULIP Distance Variation with Alpha
- TULIP Examples of Use
- TULIP Landmark Density (Average Distance between Landmarks) impact on Apollonius Error Distance
- TULIP Landmark finding
- TULIP Landmark finding the Latitude and Longitude manually
- TULIP Landmarks Analysis of tiering
- TULIP Landmarks Laundering
- TULIP Landmarks Maintenance
- TULIP Landmarks Selection of Tier=0 hosts
- TULIP Map (Landmarks)
- TULIP methods to improve speed
- TULIP Replicated Servers
- Tulip Report Generation Method
- TULIP results and code Mar 2015
- TULIP Roadmap
- TULIP SEECS CBG+ Archive Implementation
- TULIP Stress testing for Asia using CBG
- TULIP Stress Testing for Australia
- TULIP Stress testing for Europe using CBG
- TULIP Stress Testing for North America
- TULIP Stress Testing for North America using CBG
- TULIP Stress Testing for South Asia using CBG
- TULIP Summary for CBG (Visualization Tool)
- TULIP Task List
- TULIP variability of Alpha with min_RTT for Pakistan
- TULIP Web Based Visualization
- Visual Traceroute (VTrace)
Interesting papers
Visual Traceroute (VTrace)
Introduction
Visual Traceroute is a new feature that can be accessed by calling reflector.cgi with function=vtrace. Currently it can provide visual traceroute from 29 landmarks (2 in USA and 1 per each of 27 countries). Some of these are listed below, for a complete list check the from dropdown:
- www-wanmon.slac.stanford.edu, SLAC National Accelerator Lab, near San Francisco, California, USA
- pinger.cern.ch, CERN, Geneva Switzerland
- maggie1.seecs.edu.pk, National University of Science and Technology, Islamabad, Pakistan
- mel-a-ext1.aarnet.net.au, Australia's Academic and Research Network, Melbourne, Australia
- pinger.fsktm.um.edu.my, University of Malaya, Kuala Lumpur, Malaysia
lblnet-test.lbl.gov(131.243.24.12), LBL, Berkeley, California, USA
It works by first finding the traceroute to the target using the traceroute.pl installed at the landmark node and then geolocating each of the intermediate hop routers using TULIP. It can be accessed from http://tulip.slac.stanford.edu or here.
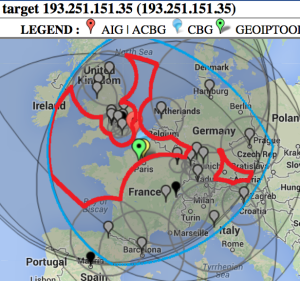
We use TULIP's dynamic ping-based geolocation as compared to say database methods such as used by MaxMind derived tools like GeoIPTools, since often router locations in the database tend to be given as at the corporate HQ that owns the routers (e.g. ESnet routers may supposedly be located in Berkeley).
Performance
Normally it would take about 10 mins to perform a complete visual traceroute but we have incorporated caching to speed up the process. As the router locations are found they are automatically cached in /nfs/slac/g/net/pinger/tulip/cachetr/cache.txt
If the location of all the routers in the requested vtrace are cached then it takes only about 10 secs to give the output.
Working Specifics
A subset of the Maxmind city database is used to find the nearest city to each router, only cities with population greater than 100,000 are considered.
- The database used is /nfs/slac/g/net/pinger/tulip/citidb.txt
Both PingER and PerfSONAR landmarks can be used as the traceroute source
- List of possible PingER landmarks is /nfs/slac/g/net/pinger/tulip/pinger_vtrace.txt
- List of possible PerfSONAR landmarks is /nfs/slac/g/net/pinger/tulip/psonar_vtrace.txt
- or simply see http://www-wanmon.slac.stanford.edu/cgi-wrap/reflector.cgi?PE=set&PSE=set&function=landmarks
Visual Traceroute can be called directly from URL. The format is:
- http://www-wanmon.slac.stanford.edu/cgi-bin/reflector.cgi?function=vtrace&from=Landmark_HostName&target=target_IP_or_HostName
- for Landmark_HostName see http://www-wanmon.slac.stanford.edu/cgi-wrap/reflector.cgi?function=landmarks in some cases the HostName is the same as IP
The From landmarks drop down list is populated from /nfs/slac/g/net/pinger/tulip/from.txt .This list if checked and updated daily from crontab using vtracefromchk.pl
Certain routers can not be geolocated because they respond to only a few pings or don't respond to them at all. A script vtrace0chk.pl tries to geolocate such routers in the cache and updates the cache accordingly each night.
Both vtracefromchk.pl and vtrace0chk.pl are placed in /afs/slac/package/pinger/tulip/ and executed via trscrontab in pinger.slac.stanford.edu for user pinger.
Design
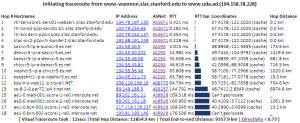
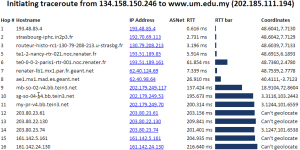
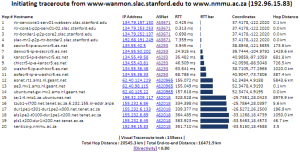
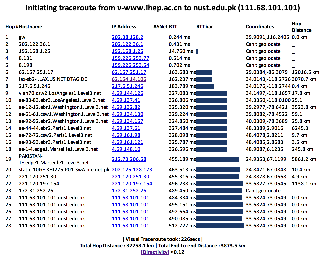
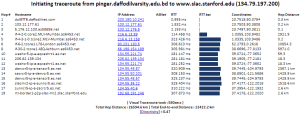
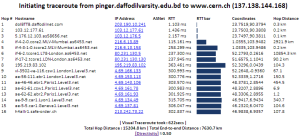
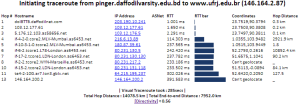
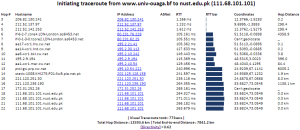
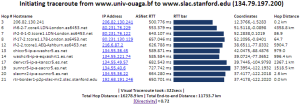
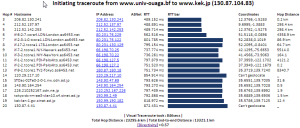
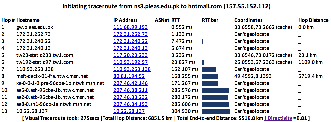
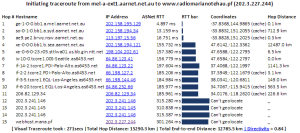
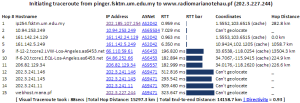
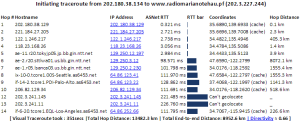
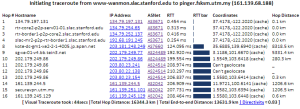
The tabular traceroute is shown together with the Autonomous System Number (ASN), if known, the router's location coordinates and distance between hops. Clicking on the IP address will take you to the TULIP geolocation utility. Clicking on the ASN will provide information on the ASN.
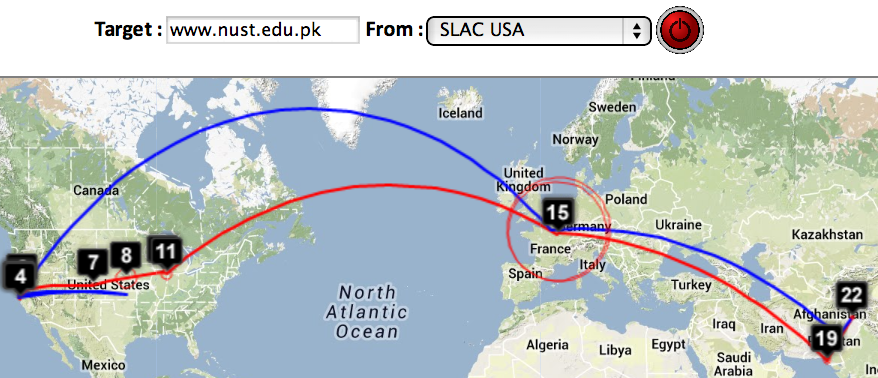
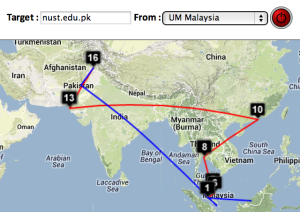
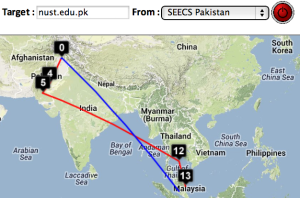
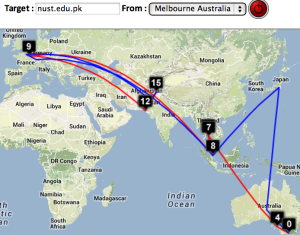
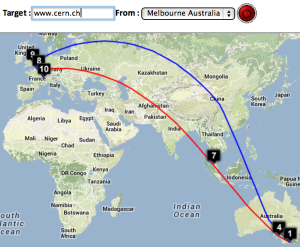
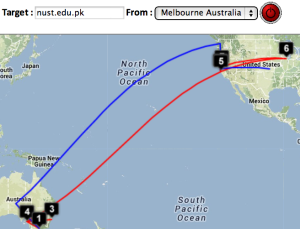
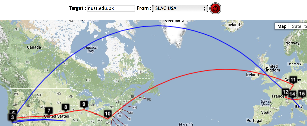
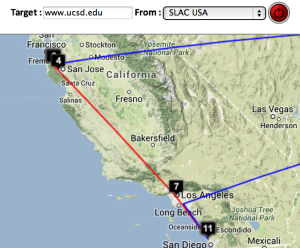
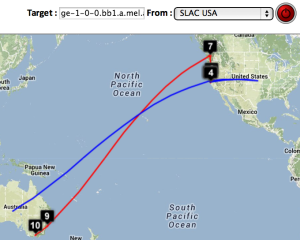
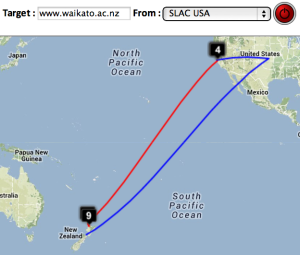
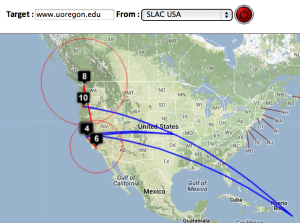
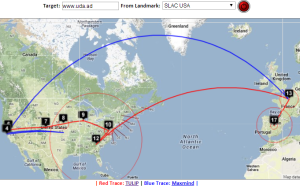
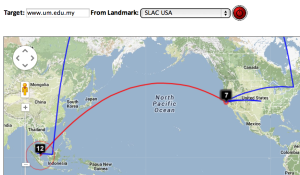
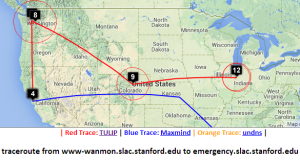
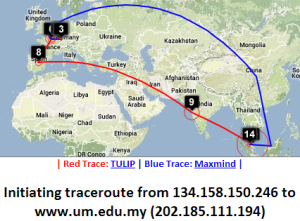
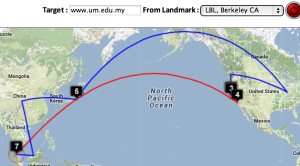
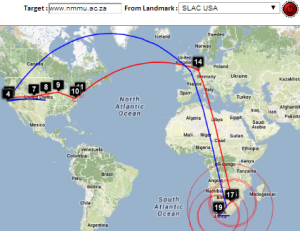
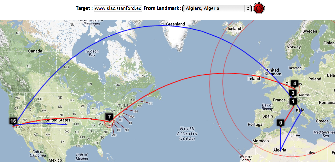
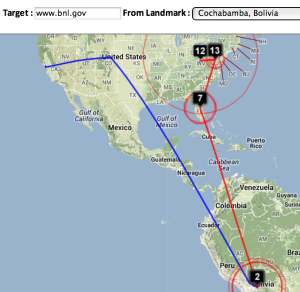
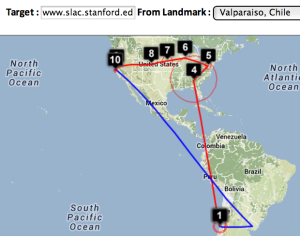
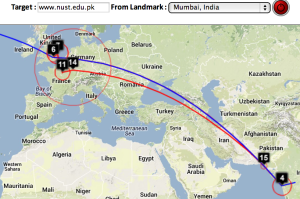
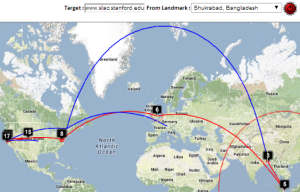
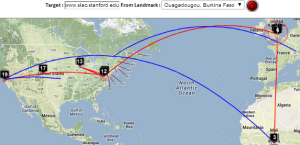
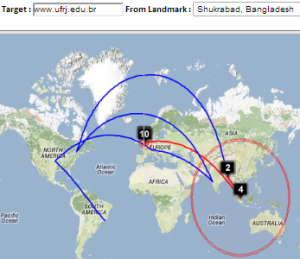
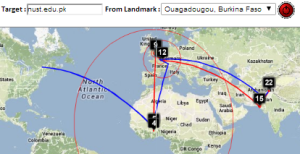
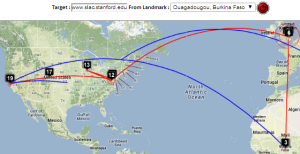
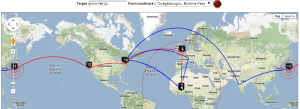
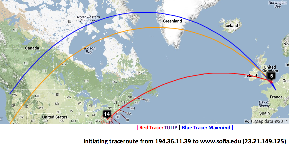
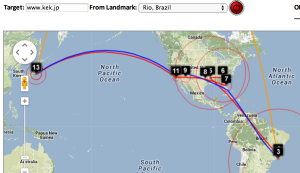
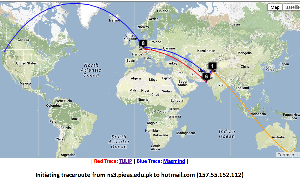
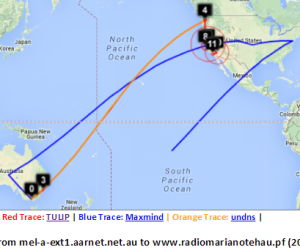
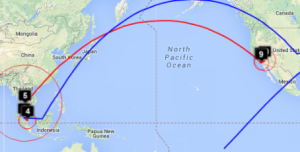
Two traceroute paths are shown on the google map. One (shown in red) is drawn using TULIP and the other (shown in blue) is drawn using MaxMind (an IP host location database). The hops are shown as appropriate numbered markers, the error in the estimated location is shown as a red circle. See the figure below:
This figure shows the traceroute from SLAC to NUST Pakistan. http://www-wanmon.slac.stanford.edu/cgi-wrap/reflector.cgi?function=vtrace&target=nust.edu.pk
Comparisons between MaxMind and TULIP
This presentation was sent to Harvey.
| University of Malaya, Kuala Lumpur to NUST Islamabad | NUST Islamabad to University of Malaya | CERN to NUST | Melbourne to NUST | Melbourne to CERN | Melbourne to SLAC | CERN to UCSD |
|---|---|---|---|---|---|---|
| SLAC to CERN | SLAC to ICTP Trieste | SLAC to NUST | SLAC to UCSD | SLAC to Melbourne | SLAC to Waikato New Zealand | SLAC to U Oregon |
|---|---|---|---|---|---|---|
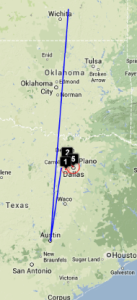
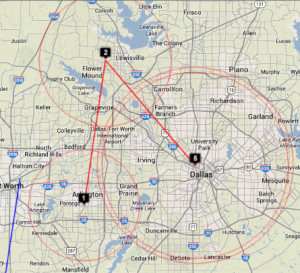
| SLAC to Andora | SLAC to Malaysia | Dallas to Dallas | Dallas to Dallas detail | SLAC to emergency.slac.stanford.edu | Detail on emergency | |
|---|---|---|---|---|---|---|
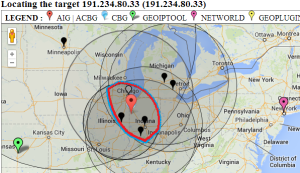
| . | GeoIPtools ends in Brazil. | |||||
| Strasbourg to UM | LBL (Berkeley CA) to UM | SLAC to Cape Town | Algiers to SLAC | Bolivia to BNL New York | Valparaiso Chile to SLAC | Mumbai to NUST, Islamabad |
|---|---|---|---|---|---|---|
| Beijing to NUST | Bangladesh to SLAC | Bangladesh to CERN | Bangladesh to Rio de Janeiro | Burkina Faso to NUST | Burkina Faso to SLAC | Burkina Faso to KEK Tokyo |
|---|---|---|---|---|---|---|
| Taiwan to NUST | England to Washington DC | TULIP location of Sofia University | Rio to Tokyo |
|---|---|---|---|
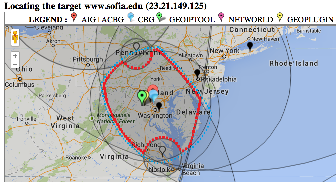
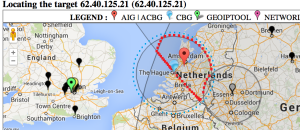
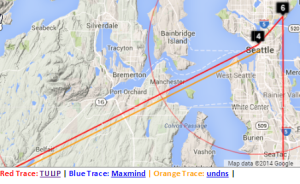
The England to Washington DC is interesting since VTrace, Maxmind and undns (orange line) give very different results for the target. Despite Sofia University advertising itself as being in Palo Alto the web server is actually near Washington DC. Also the route does not go from London to Paris as indicated by Maxmind.
Complementarity of VTrace and MaxMind
SLAC to Portugal
| SLAC to Braga Portugal overview | SLAC to Braga, W. Coast US | SLAC to Braga via Netherlands and UK | SLAC to Braga, Portugal detail | Traceroute | TULIP geolocation of Braga |
|---|---|---|---|---|---|
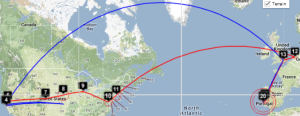
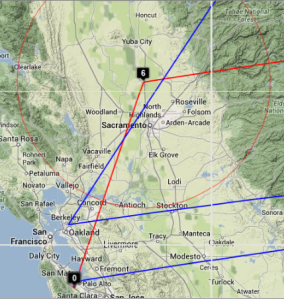
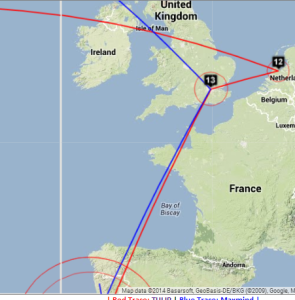
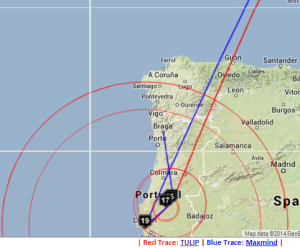
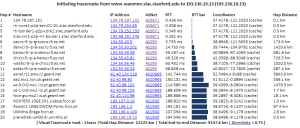
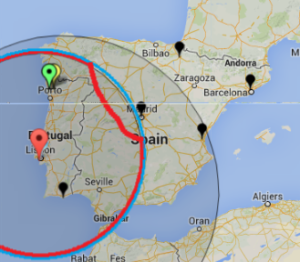
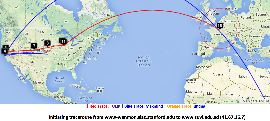
By providing both VTrace (red) and Maxmind (blue) routes, the results can be complementary in ascertaining the correct route. This is illustrated in the plots below from SLAC to a host in Braga Portugal (193.136.19.13). The left hand map shows how VTrace accurately traces the route across the US, while Maxmind jumps from SLAC to the middle of the US, back to Berkeley and thence to Europe. This is shown in more detail in the W. Coast US map. Moving futher right, Vtrace shows the route through the Netherlands and the UK, while Maxmind misses the Netherlands altogether. The Portugal detail indicates that Maxmind is more accurate in showing the final route to Braga. However, note that the Vtrace accuracy circles indicate the considerable uncertainty in the location of the last hop, hence improving one's confidence. The traceroute figure which indicates that hops 12 and 13 are likely to be in the Netherlands and the UK given their naming conventions (note the top level domains .nl and .uk in the names). The TULIP plot shows how the paucity of nearby landmarks (black market balloons) results in the poor geolocation of the Braga site.
Cape Town to Tokyo
| Cape Town to Tokyo | Amsterdam hop 9 seen by TULIP |
|---|---|
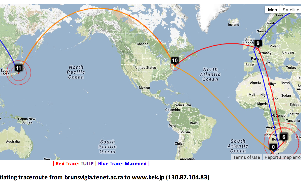
Maxmind catches hop (8) in Europe (but gets hops 8 and 9 in London rather than Amsterdam) that VTRace (hop 8 does not respond to pings) misses and undns (orange line) misses both hops 8 and 9. VTRace catches the Johannesburg hop (4), and Pretoria hops (5) that undns and Maxmind miss. VTRace and undns catch the New York hop (10) that Maxmind misses.
SLAC to Burkina Faso
| SLAC to Burkina Faso |
|---|
Maxmind gets the location of the hops in France, but does not do well in the US.
Pakistan to Washington State
| Pakistan to Microsoft WA |
|---|
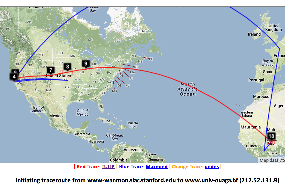
For the Pakistan to hotmail.com (Microsoft WA) undns gets off track and goes to Australia. VTrace correctly gets hop 6 as being in Karachi (while Maxmind puts it in the middle of Pakistan), however VTrace loses track after getting to Frankfurt Germany (since hops 9-13 do not respond to pings), while Maxmind gets the end destination as being Microsoft's home of Redmond Washington.
SLAC to Sudan
| SLAC to Sudan | Location of 16th hop |
|---|---|
VTRace gets the route across the US and to France, but not the last hops to Sudan. DeoIPTools gets Sudan as the final destination.
Melbourne to French Polynesia
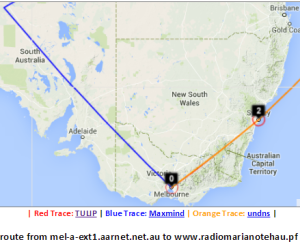
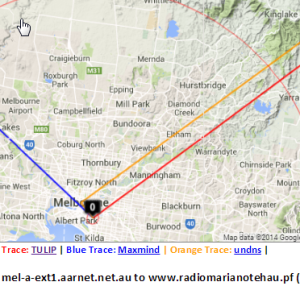
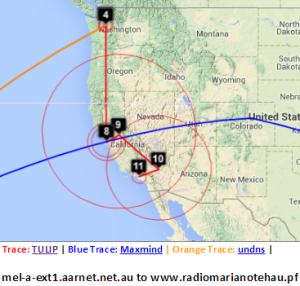
| Melbourne to French Polynesia | Detail for Australia | Detail of VTrace & undns at Melbourne | Detail of W. Coast US | Detail showing VTrace & undns at Seattle | Malaysia to French Polynesia | Japan to French Polynesia |
|---|---|---|---|---|---|---|
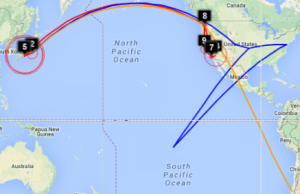
Maxmind gets the location of the host in French Polynesia. However the route in Australia and the US is badly off. Vtrace and undns agree for Australia and for hops in the US. VTrace does not work for French Polynesia since the underlying TULIP does not attempt to locate a host where the nearest Tier 0 landmark (SLAC) has > 60msec min_RTT. N.b. Australia's route to French Polynesia goes via the U.S. as does Malaysia's, and Japan's. The Japan traceoute is interesting in that undns shows the route as going via Chile. THis requires more investigation. The landmarks in China and Bolivia were unable to make traceroutes.
Miscellaneous
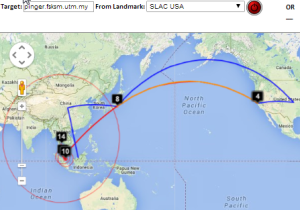
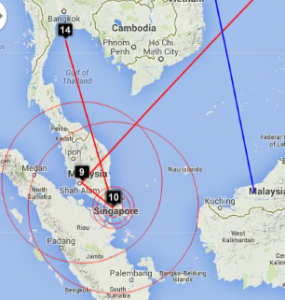
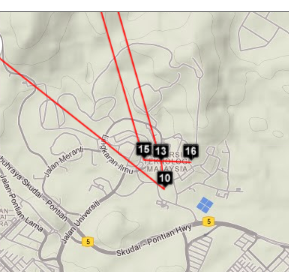
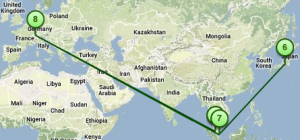
The traceroute from SLAC to UTM, Johor Bahru, Malaysia for MaxMind goes to central US, Japan, then via China and terminates in Sarawak. The VTrace goes from SLAC to Japan (undns confirms this), then to Kuala Lumpur Malaysia, then to Johor Bahru. It then takes an excursion to the Gulf of Thailand (hop 14) and appears to stop there (middle image below). On more detailed inspection (right hand image below), it is seen that it then returns to Johor Bahru and UTM (hops 15-16).
| Global view of SLAC to UTM, Johor Bahru,Malaysia | E. Asia part of route | Last few hops |
|---|---|---|
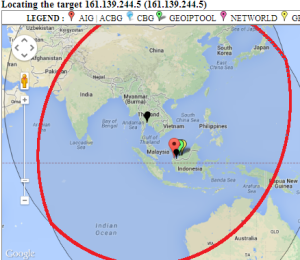
Looking in more detail at hop 14, only 4 landmarks have a minimum RTT of < 60ms. Three are in Thailand and one in Kuching Malaysia. See left image below. There are other landmarks in the area, one at UTM in Johor Bahra, Malaysia, another at UM in Kuala Lumpur. However, for unknown reasons neither UTM nor UM were able to ping 161.139.244.5.
| Landmarks with < 60msec minimum RTT to 161.139.244.5 | Geolocation of 161.139.244.5 | |
|---|---|---|
Other Visual Traceroutes
- CQ Traceoute, one server in St Paul, Minnesota, gives country, lat/long and distance of router from server, shows map as static image
- DNSTools, one server in Frankfurt, no lat/long, provides map
- WhatismyIPaddress, only takes IP addresses, tabular output identifying city, map shows end point only
- Montis, has 3 servers, in US (Pacific Northwest), Europe (Ireland) and Asia/Pacific (Singapore), provides map, no lat/longs or cities
- Visualware, can choose server region and a limited number of target regions, requires Java, does not support traceroutes
- VisualRoute, buy application, identifies city, no lat/longs. no map
- Free Visual, download free application, don't see a map
- GTrace, download free application, has map
- VTrace multiple servers, gives lat/long plus error, provides map,city, country code
Of these Montis appears to be the most reasonable to compare with.
| Montis Server in Singapore to UM Kuala Lumpur | ||
|---|---|---|
PingER LOD
This is a project to provide Linked Open Data access to PingER data.
- PingER LOD Home page
- PingER LOD project Wiki documentation.
- PingER LOD publications
- Proposed project by Ibrahim at UM
- PingER and Hadoop proposed by Ridzuan, also see the original proposal
PingER Warehouse
- PingER Data Warehouse using Big Data with Cloudera on Nebula
- Applying Data Warehousing and Big Data Techniques to Analyze Internet Performance, T. M. S. Barbosa, R. F. Souza, S. M. S. Cruz, M. L. Campos and R. L. Cottrell. SLAC PUB, submitted to NETAPPS 2015.
- Survey on Big Data Indexing strategies, Fatima Bintu Adama, Adib Habbal, Suhaidi Hassan, R. Les Cottrell. Bebo White, Ibrahim Abdullahi.
PingER and BigData
Leveraging PingER big data via modified pingtable.
PingER and perfSONAR
At one time perfSONAR supported PingER. This was discontinued October 2014.
Comparison of PingER and perfSONAR.
