We measured the RTT from each landmark to all the other landmarks within a known distance. We noted the landmarks lat/long, its name and address, the number of samples, the calculated correlation coefficient R^2 between RTT and distance, the minimum, 25 percentile, median, 75 percentiles and maximum for the RTT, distance, and alpha. Using Excel we plotted the number of samples (n) and the R^2 versus the country/region. Two examples are shown below for different maximum known distance thresholds.Each x-axis value is for a different landmark, and the data is sorted by regions and then by R^2.
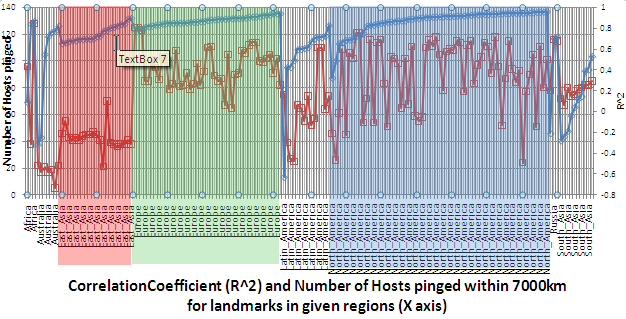
The spreadhseet for the 7000km data can be found here. For the 7000km maximum distance data, it is seen that low values of n often result in low values of R^2. Also for East-Asia, Europe and North America the correlations are usually strong (R^2 > 0.6).

The spreadsheet for the 1000km data can be found here.
Overview
Content Tools