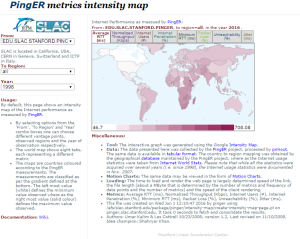
Data Explorer also here
Motion charts


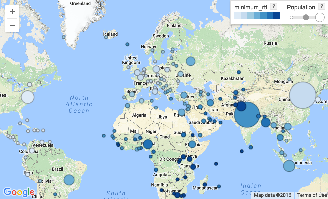
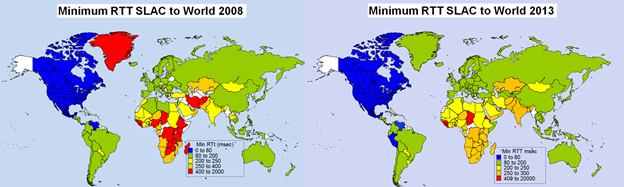
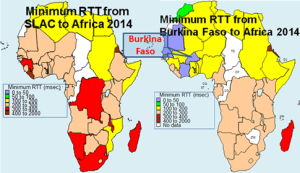
Maps

 Color =loss, height=RTT with median and jitter, color=throughput (or MOS), with pan/zoom and click for more information (time series, details of site) or slider for time.
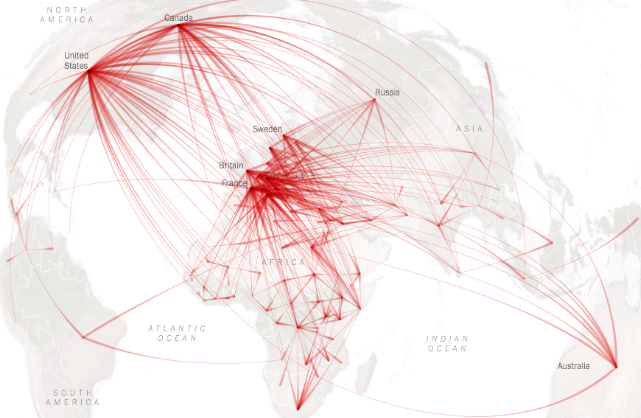 Color=metric value, lines from MAs to targets. Could also make color=MA
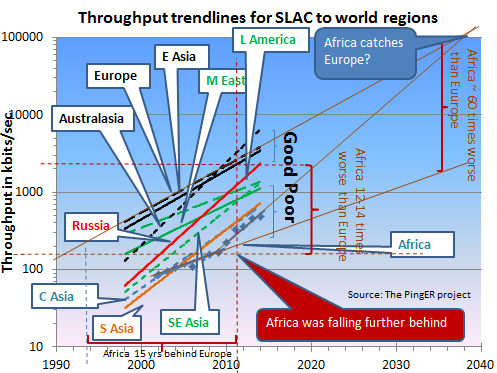
Trendlines
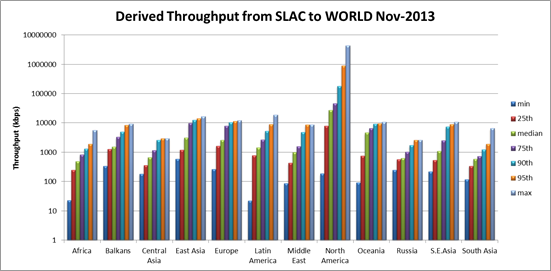
Percentiles
 ,
, 
Multiple source and destinations
Multi-metrics
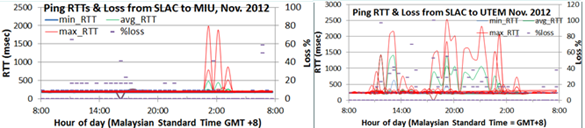
Also with multiple y scales (not just 2)
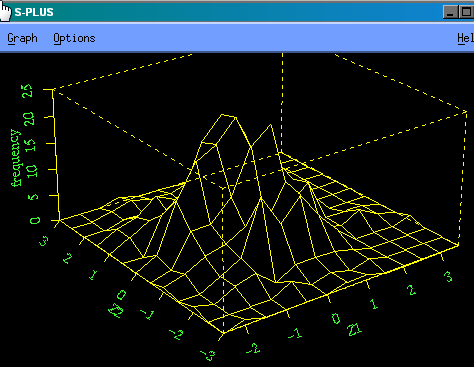

S-Plus brush function
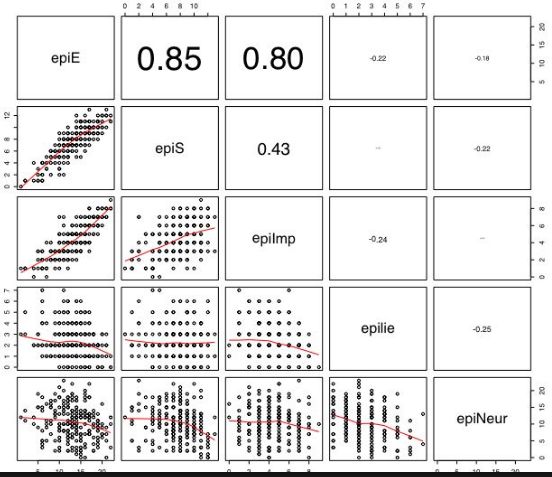
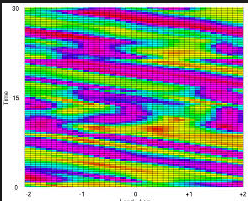
Correlations