Introduction
PingER (Ping End-to-End Reporting) is a project that monitors network performance of Internet links world wide. It has almost 1000 nodes that spread through out the world and covers 99% of internet population of world. Every day monitoring nodes collect data available by pinging remote nodes and provides this data to archive node that is responsible for analysis of this data. PingER has a decade old data of network performance of different internet links which is very useful in many internet applications related fields.
Motivation and Purpose
PingER archive site(or node) architecture is based on flat-files i.e it collects ping data, processes this data, stores the results, and display results to end user using flat-files. As the internet usage increases in world, number of PingER nodes for network monitoring also increases due to which a huge amount of data is to be processed and store by archive site daily using flat-files. Now this flat-files approach is no longer scaleable and manageable with current amount of data so the PingER archive site architecture should be changed from flat-files to relational database for achieving performance, speed, manageability and scalability in PingER archive sit operations.
Methodology and Mechanism
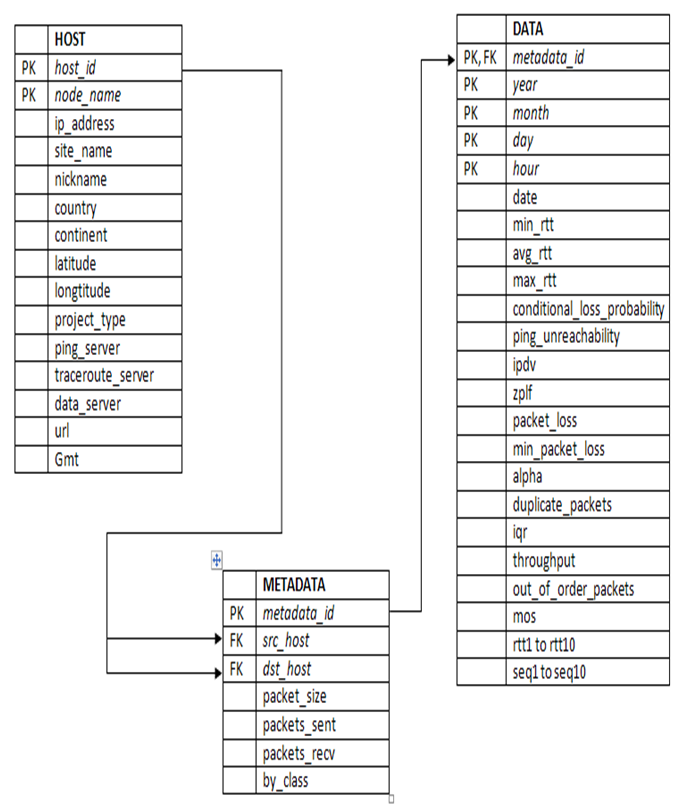
For change archive site architecture from flat-files to relational databases we first make a database schema which is suitable for archive site data requirements i.e tables instead of flat-files are used for collection,processing and storage of data. Our final purposed has three tables one has nodes information, one has metadata and last table is data which contains results. Schema is shown below:
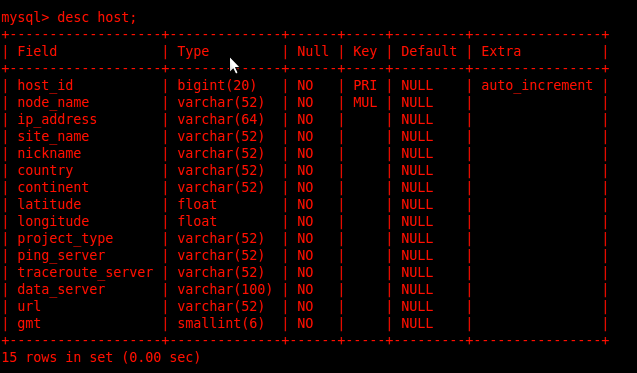
Host table containing all PingER nodes information:-
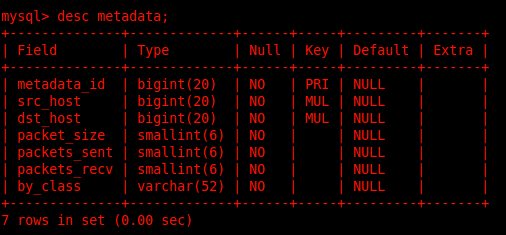
Metadata table contains all metadata of results:-
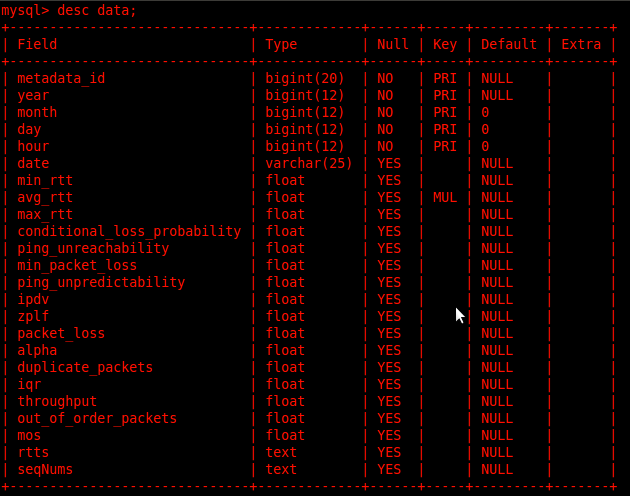
Data table contains final results of different network metrics:-
The Relationship between these tables of PingER Schema is shown below in an ERD Diagram:-
Implementation
To implement archive site according to the tables shown above we have a need to combine two scripts. One for data collection and one for hourly data analysis. So we combine getdata.pl script with analyze-hourly.pl script and formed a new getdata_new.pl script which do the same task as these both scripts collectively have done before. The requirement of combining these two scripts comes because in this new schema raw data (ping data) which is collected from different monitoring sites is processed at run time and generated results are stored in data table while in previous flat-files version raw data is stored in separate flat-files by getdata.pl and then analyzed by analyze-hourly.pl which stores results in other flat-files.
After creating this new script we test it. It still gives more time than flat files. We scan this code and find many blocking operations present in this code i.e database write operation blocking. We remove these blocking operations by processing each line and store results in hash keys instead of inserting in to tables and when all results of one day data is calculated the at last all results are inserted into tables. This step removes the blocking of database write operation that took place for every processed line. By this we also achieved speed and database performs better than flat-files.
For achieving more performance we change this new script from uni-threaded to multi-threaded i.e data collection and data analysis operations run in parallel to each other. The mechanism is that when the data is downloaded for 5 monitoring sites a separate thread is created and this collected data is passed to this new thread for analysis operations and at the same time data collection for other monitoring sites is also running in parallel to this analysis thread. The performance or speed results after these optimizations are shown below:

Above figure shows the time taken by both flat-files and databases for calculating and analyzing one day data for certain number of monitoring sites. As above figure does not show a big gap between flat-files and databases performance, the reason is that major time is taken by data collection not data analysis and data collection using network wgets takes same time for both flat-files and databases. After this we change pingtable.pl to read analysis results from tables instead of flat-files and show these results on the browser. At this point we change pingtable.pl to show only hourly results not daily and monthly results. They are shown when we complete daily and monthly analysis discussed below in this chapter.
Daily analysis:
We daily do the hourly analysis of one day data and generate results. After this we do daily analysis of one month's data or for certain number of days i.e 60 or 120 days. Daily analysis is not as complex as hourly analysis because we need not to apply specific formulas to calculate different metrics instead it uses just the hourly analysis results generated by gatdata_new.pl and aggregate hourly values for one day. Similarly in last 60 or 120 days analysis we just aggregate hourly data of respective days for each metric.
Now as we use MYSQL database instead of flat-files so there is no need to write special block of code for aggregations because MYSQL has its own built-in aggregation functions which are used for calculation of daily analysis results. So in analyze-daily.pl aggregated data is selected through SQL queries then metrics like throughput and unpredictability (whose values are calculated using other metric values) are calculated using these results and then the final result for one month or for certain number of days is inserted into data table. Both hourly and daily data are present in the data table and is differentiated by the hour column i.e for daily data a dummy value is inserted in hour column which does not represent an hour so a daily analysis record is identified.
After this we change pingtable.pl to query daily results from table instead of files and show formatted results to user for a certain month or for last 60 or 120 days.
Monthly and yearly analysis:
Monthly and yearly analysis are same as daily analysis because monthly analysis use results generated by daily analysis and yearly analysis use the results generated by monthly analysis. In addition to it we also add some more analysis intervals in pingtable.pl like last365days and allyearly which are present at pingtable.pl version of SLAC but not present at pingtable.pl version of SEECS.
Basically monthly tick shows monthly data of one year in pingtable.pl and allmonthly tick shows analysis data of all months which are present data table.