Shahryar Khan and Les Cottrell
Purpose
The purpose of this study is to investigate the effectiveness of tiering for TULIP (i.e we have a set of primary landmarks tier0 which will narrow down the target location to being in a particular region*[1] and then a denser set of secondary tier1 landmarks in the discovered region that can be used to get more accurate results). The use of tiering should enable us to reduce the network traffic (number of landmarks pinging a target) while retaining the accuracy of using all landmarks.
Currently we are looking into two regions where we hope to use tiering, i.e. North America and Europe. The choice of these two regions is since we have a relatively large number of landmarks in these regions. Landmarks in all other regions will be considered as tier0. Thus TULIP will try and locate targets in two passes. The first just uses tier0 landmarks. If the target then appears to be in North America or Europe, then a second pass is made using all the landmarks in that region, otherwise the target is determined from the first pass. The purpose of the current study is to determine whether tiering is effective and how it should be used.
North America
We selected 4 landmarks in North America for our study( SLAC, BNL, Ampath-Florida,TRIUMF-Canada). They were chosen to be reliable and to roughly be located close to the 4 corners of the region. We pinged a set of known geographical target sites in the US, Canada and Mexico. The coordinates of the sites were obtained from the PingER database. We also calculated the physical distances between the target sites and the landmarks. The figure below shows the distribution. It appeared that all hosts were within 80ms of one another of the 4 monitors and 98.84% are within 70ms.
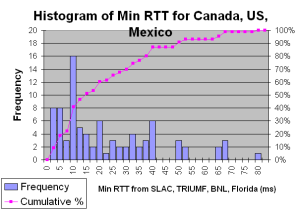
Here are graphs of data seen from four landmarks
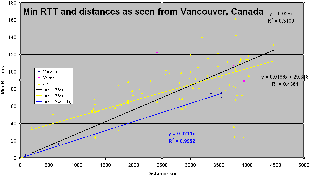
As we can see from the first graph that some sites are replicated (e.g. DNS root name servers, Yahoo), others are not at a permanent location (e.g. supecomp moves annually with the locvation of the SupeComputing show) or use strange routing (e.g. the site labelled 134.79 a SLAC host located elsewhere, though the routing goes through SLAC). We ignore such hosts in our results, though we note that this analysis has clearly pointed out such anomalies. It is also seen that some values for Mexico are aberrant for example min rtt >200 for a Mexican site from Florida. So it is a good idea not to include Mexico in this region. This region will therefore comprise of Canada and US only.
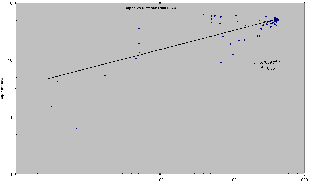
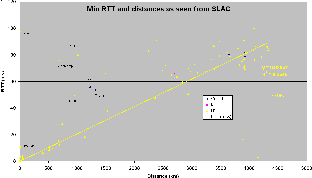
The above graph shows how alpha varies with distance. Using a single alpha may fail for small RTTs (distances). This is probably since the min_RTT is dependent on router delays and where networks peer, so the routes may be very different from the Great Circle Distance (GCD), and the min_RTT may be only partially dependent on distance.
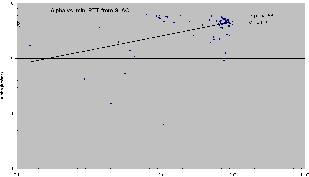
Looking at the graph above of Alpha vs min_RTT from SLAC it appears there are two regimes separated at ~8ms. Above 8ms alpha is ~ 50km/ms, below it is more variable closer to ~10km/ms. One can use a smooth power function to predict alpha given the min_RTT as shown in the figure. However it is as easy and probably more accurate to use the two values.
We also calculated median alpha from SLAC which is ~ 46.5km/ms and IQR ~15.6km/ms or IQR/Median~ 33% or ~ +-16%
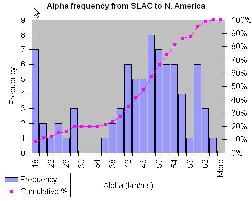
Faran uses the maximum alpha value in order to avoid underestimation which is ~ 62.98 km/ms in our case. Also Faran calculates alpha based on PingER historical data to all the world regions and in this study we only used the North American PingER sites. Looking at the frequency histogram of alpha for the SLAC landmark to North American target sites it is seen that this is a reasonable maximum value.
Europe
We selected 3 landmarks in Europe for our study ( CERN_Switzerland, ICTP_Italy, UK_Warrington). They were chosen because they were more reliable as compared to other landmarks. We pinged a set of known geographical targets in Europe. The coordinates of these sites were obtained from PingER database. We also calculated the physical distances
between the targets and the landmarks. It appeared that all the hosts were within 65 ms of the three landmarks and 96.15 % were within 50 ms.
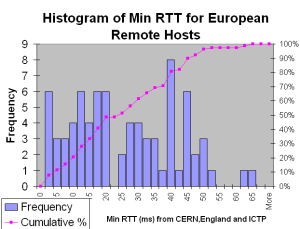
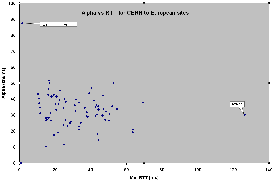
Here is the data seen from CERN_Switzerland.
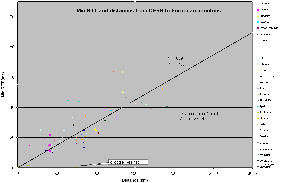
There is a very strong co-relation between the Min RTT and distances (R2 ~= 0.77) from CERN to European countries. The value of Alpha from Line equation is 33.44 (Km/ms).
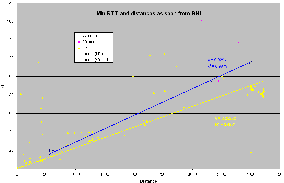
Below is the graph of Min RTT and distances as seen from England to European countries
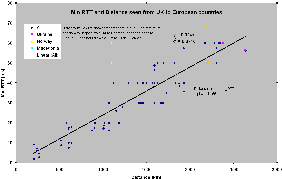
There is a very strong co-relation between Min RTT and distances as seen from England to other European countries (R2 > 0.85 ). The value of alpha from line equation is 41.66(km/ms). Norway in this graph have aberrant results the reason for this is that it fallow a longer distance than Great Circle Distance. The traceroute result shows that it goes through Denmark.
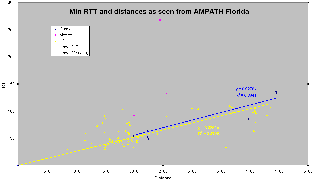
Below is the graph of Min RTT and distances as seen from ICTP_Italy.
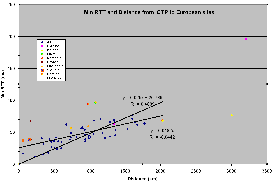
There is no strong co-relation between Min RTT and distances in this case( R2 =0.4). This is because some of the routes (e.g. Balkans region route goes from Trieste on border of Slovenia, North to Vienna and then back to Slovenia, Croatia etc.) are very indirect. The value of alpha from line equation is 20.74 (km/ms).
The graph below shows the alpha distribution from CERN to Europe.
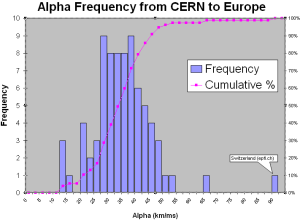
The median value of alpha from CERN to Europe is 32.55 (km/ms). The IQR is 11.61 km/ms or IQR/Median~ 36% or ~ +-18%. The maximum value for alpha is 87.55 Km/ms (CERN to EPFL) which is because CERN and EPFL are only about 100 km away from each other, so selecting the highest value of alpha in this case may be mis-leading.
Below is the graph for Min RTT vs distance from CERN to European countries. We can see that that alpha does not change much with distance.
The graph below shows the alpha distribution as seen from England to European countries.
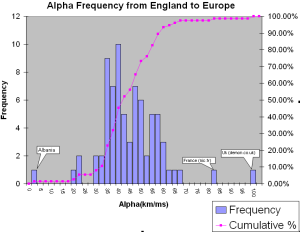
The median value of alpha from England(Warrington) to Europe is 40.71 (km/ms). The IQR is 15.6 (km/ms) or IQR/Median~ 38% or ~ +-19%. The highest value of alpha 97.72 (km/ms) is due to a very small RTT (2.6ms) between (demon.co.uk) and this landmark which are 263 km apart.
The graph below shows the alpha distribution as seen from Italy to other European countries.
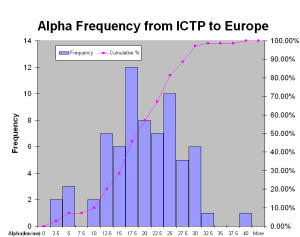
The median value of alpha from ICTP (Italy) to Europe is 18.91 (km/ms). The IQR is 10.98 (km/ms) or IQR/Median is ~58% or ~+-29.5%.
Conclusions
- Tiering can be used in N. America and Europe. ( Heuristics can be derived from this analysis which will narrow down the region of a particular host)
- The Great Circle distance and the path which the packets fallow may be different.
- The hosts which are near the landmark may have very high values of alpha.
References
[1] A region may be different then a geographical region