The February 2016 Scientific American article on "Six Billion in Africa" by Robert Engelman projects Africa's population growth drives global population growth based on the fertility rates. Such extreme growth threatens Africa's development and stability. The United Nations' current prediction is that by 2100 the world population will exceed 11 billion. We decided to see if there is a correlation between throughput derived from PingER measurements and fertility rates.
Data sources
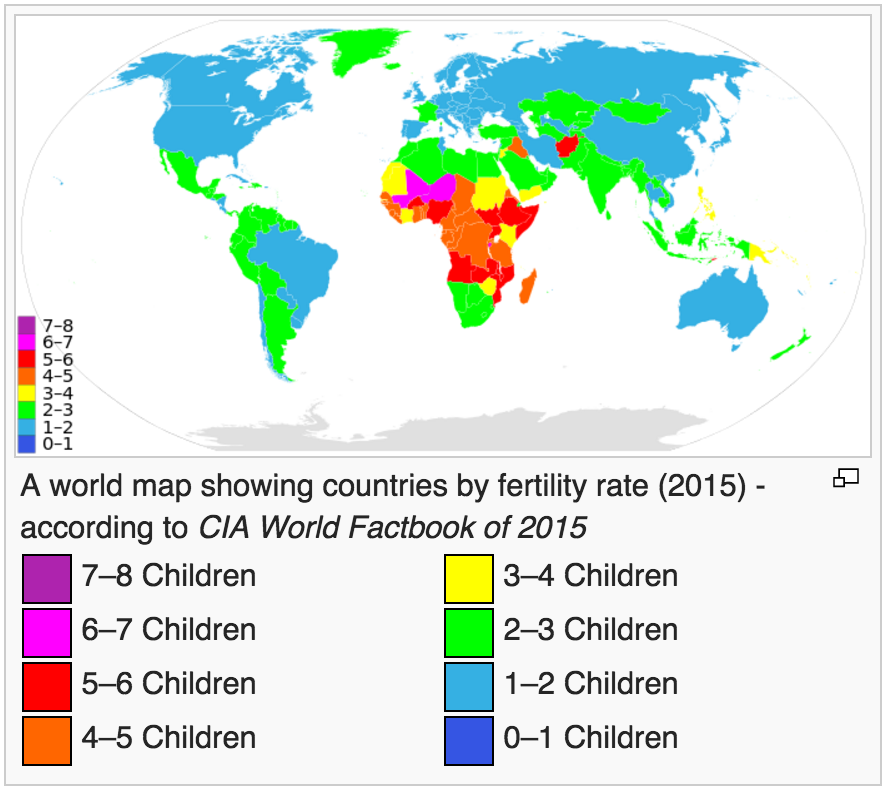
- We used the CIA World fact Book Country Comparison Fertility Rate (children born per woman) to provide a list of countries and their Fertility Rate for 2015. The map below from Wikipedia shows the distribution of Fertility Rates by country.
- We used http://www-iepm.slac.stanford.edu/pinger/pcm.html to provide the PingER throughput for 2015 for each country.
- The country name to TLD were derived from http://www-iepm.slac.stanford.edu/pinger/tld_country_list.txt
- The country name to regions was obtained from http://www.slac.stanford.edu/comp/net/mon/countries.tsv
- The populations were obtained from /afs/slac.stanford.edu/g/www/cgi-wrap-bin/net/offsite_mon/pinghistory/outputCountryPop.txt
Analysis
We decided to use the PingER derived throughput to illustrate the Internet performance. This is derived using the Mathis formula relating throughput to loss probability (p) and Round Trip Time (RTT) as Throughput < (MSS/RTT)*(1 / sqrt(p)) where: MSS: is the maximum segment size (fixed for each Internet path, typically 1460 bytes)
The fertility data, TLD data and throughput data were imported into an Excel spreadsheet. We used the Excel vlookup function to create a table of; Fertility Rate, median throughput, population for each country.
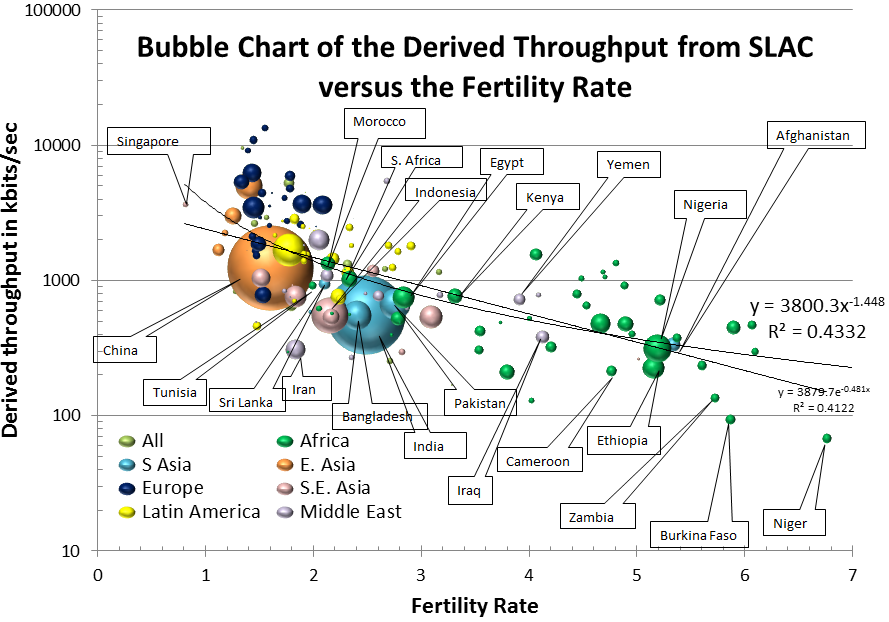
From this we created a bubble plot of x=Fertility Rate, y=throughput, bubble volume=population and colored the bubbles by the region. We also added an exponential trendline. The PingER derived throughput is inversely proportional to the Round Trip Time (RTT) and the RTTs are relativley short since they are measured from SLAC in North America. Thus the throughputs for North America are abnormally high so they are not included in the plots.
It is apparent that there is a negative correlation between throughput and fertility rate (i.e. countries with a lower Fertility Rate have a higher value of throughput). It is also apparent that Not only does Niger have the highest Fertility rate but it also has the lowest Internet performance, and as a region Africa leads the world in Fertility Rates and has the lowest Internet performance..
The low throughputs for Africa are disturbing since achieving significant fertility declines requires education and easy access to information and this in turn is enabled by good internet access. Thus countries such as Niger, Burkina Faso and Zambia with high Fertility Rates and low Internet performance are particularly at risk.
Also see correlations between PingER data and development indices

