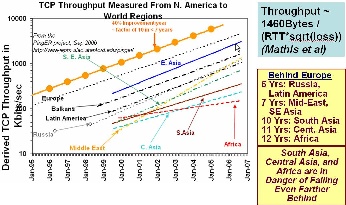
The graphs above show the derived TCP throughput using the Mathis formula. The macroscopic behavior of the TCP congestion avoidance algorithm by Mathis, Semke, Mahdavi & Ott in Computer Communication Review, 27(3), July 1997, provides a short and useful formula for the upper bound on the transfer rate:
Rate <= (MSS/RTT)*(1 / sqrt(p))
where:
Rate: is the TCP transfer rate or throughputd
MSS: is the maximum segment size (fixed for each Internet path, typically 1460 bytes)
RTT: is the round trip time (as measured by TCP)
p: is the packet loss rate.
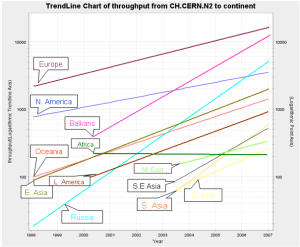
In the left hand two graphs the data points (average throughput per month) are fitted to exponential functions and for simplicity the trend lines only are shown. These lines enable us to see that Russia and Latin America are 6 years behind Europe, the Mid-East and SE Asia are 7 years behind, and S. Asia, C. Asia and Africa are 10 years or more behind. What is even more concerning is that Africa (in particular), South and Central Asia are not catching up.
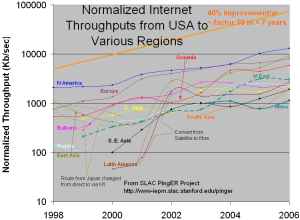
The right hand most figure shows the yearly average derived TCP throughput normalized by the minimum RTT for the region (to reduce the proximity effects). It is seen that the throughputs are not simply exponential straigh lines, but typically change in steps as major changes are made in the routing and circuits.