We made reflector measurements of RTT from landmarks around the world to target landmarks in Australia. From this we created a histogram of alpha frequencies for each of the target landmarks in Australia. An example is shown below for the Sydney Australia target landmark. 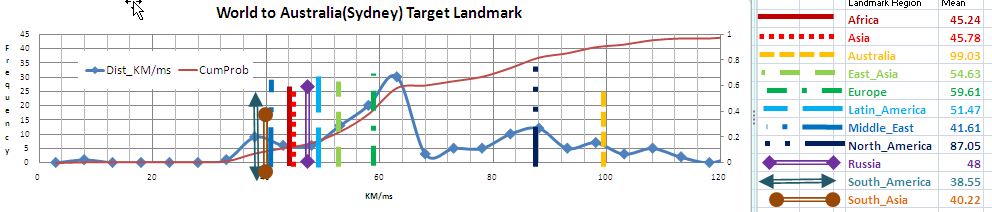
It is seen that the distribution is multi-modal. Many of the modes can be associated with landmarks from a regions having similar values of alpha for the measurement to Sydney. More data can be found in the spreadsheet. From this it is apparent that a single value of alpha is a poor approximation to the behavior of alpha. A spreadsheet of World to European targets is also available.