...
N.b. I am having problems with using www.charte.ca as one increases the number of Excel lines of data beyond around 2000. It often times-out after several minutes and asks if I wish to continue to wait, this may happen several times and there appears to be no guarantee it will finally provide a result, instead basically locking up and requiring re-logging into www.charte.ca. This is the reason the data is sometimes divided by Jan-Apr and May-Jun, and we only look at the data for each of every few (e.g.5) days. Also why we reduce the number of countries in a chart to <=10.
United States
| Include Page | ||
|---|---|---|
|
...
|
...
- time series plot of the US Confirmed cases by state on a log scale.
- percent deaths/confirmed cases by state as a function of date:
US States Motion Charts of Covid-19 deaths vs confirmed cases
Cumulative:
- cases with bubbles sized by US state population and colored by per capita income (Jan 28, 2020 - Apr 28, 2000)
- cases per million population with bubbles sized by US state population (May 1, 2020 - Jun 22, 2020)
- cases per million population with bubbles sized by US state population and colored by per capita income (May 1, 2020, Jun 25, 2020)
- cases with bubbles sized by population density of state and colored by per capita income (May 1 2020 - Jun 26, 2020)
- March 1, 2020 - July 20, 2020


Daily:
- daily cases per million population with bubbles sized by US state population and colored by per capita income (May 1, 2020, Jun 26, 2020)
- cases with bubbles sized by US state population and colored by per capita income (May 1, 2020, Jun 26, 2020)
Observations
...
- Arizona's increased confirmed cases pulled it away from the pack starting May 14, 2020, and Florida pulled away starting May 24, 2020
- The values of new Confirmed cases/day/Million State population appears to decrease as one moves forward in time beyond May 23 but then to increase again (driven by Arizona) starting June 14, 2020. Maybe this is part of the "opening".
...
- At the start of May there is a noticeable correlation between deaths and confirmed, by the end of June the correlation is much weaker
- At the start of May the deaths and confirmed is dominated by New York (NY), New Jersey (NJ), Illinois (IL), Massachusetts (MA), California (CA) and Maryland (MD). By the end of June California (CA)is still a leader joined by Texas (TX), Florida (FL), Arizona (AZ), and Georgia (GA).
...
- Some states with high population densities such as New York (NY), New Jersey (NJ) and Massachusetts (MA) have high numbers of confirmed cases while others such as Washington DC, Rhode Island (RI), Delaware (DE) have fairly low numbers of confirmed cases.
...
- Exceptions that are still increasing include: NJ, MA, PA, CT, SD, NH, IL.
...
Looking at the July 24, 2020 JHU data there is a strong correlation between the total Confirmed case/state population and the % Hispanic + Black of the state's population.
| Confirmed cases/population vs % Hispanic & Black (bubble sizes proportional to state's population) | Confirmed cases/population vs % Black (bubble sizes proportional to state's population) | Deaths/population vs % Hispanic + Black (bubble sizes proportional to state's population) |
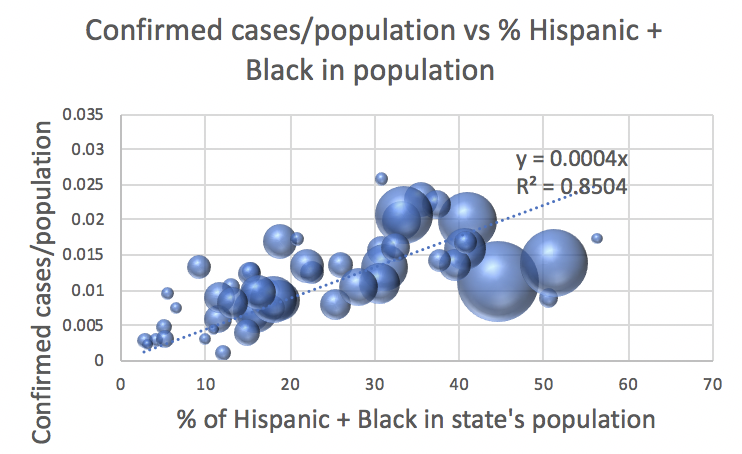 |  |  |
...
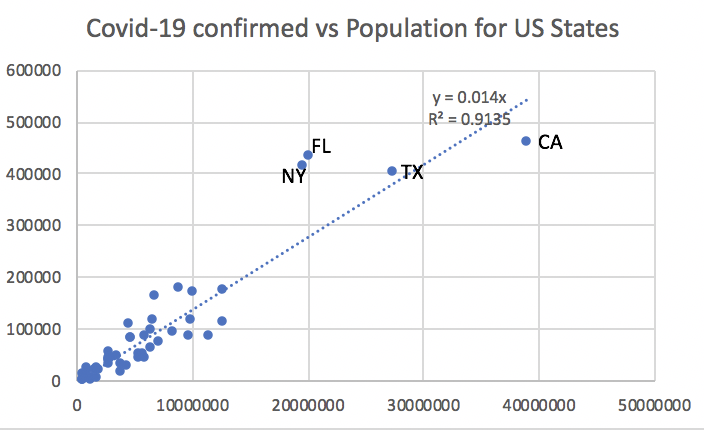
As would be expected there is strong correlation between the number of reported confirmed cases and a state's population and a noticeable correlation between the reported deaths and a state's population.
| x axis is the state's population, y axis is the reported Confirmed cases on July 27. | x axis is the state's population, y axis is the reported deaths on July 27. |
|---|---|
 |
|

...
The ten states with the leading confirmed cases/population as of 7/26/2020 were:
| State | ID | confirmed/Pop | deaths/Pop | Pop-Density(pop/sq-km) |
| Delaware | DE | 0.026143 | 0.00143 | 485.343 |
| Arizona | AZ | 0.023728 | 0.000484 | 60.109 |
| Louisiana | LA | 0.023032 | 0.000806 | 108.109 |
| Florida | FL | 0.020909 | 0.000289 | 378.019 |
| New York | NY | 0.020799 | 0.001648 | 420.061 |
| New Jersey | NJ | 0.020023 | 0.001762 | 1218.114 |
| Mississippi | MS | 0.01765 | 0.000502 | 63.771 |
| District of Columbia | DC | 0.017524 | 0.000864 | 11020.131 |
| Rhode Island | RI | 0.017253 | 0.000949 | 1021.565 |
| Massachusetts | MA | 0.017019 | 0.001255 | 871.08 |
The lowest ten states were:
| State | ID | confirmed/Pop | deaths/Pop | Pop-Density(pop/sq-km) |
| Hawaii | HI | 0.001176 | 0.000018 | 222.887 |
| Vermont | VT | 0.002236 | 0.000089 | 67.923 |
| Maine | ME | 0.002869 | 0.00009 | 43.1 |
| West Virginia | WV | 0.003193 | 0.000056 | 76.717 |
| Montana | MT | 0.003234 | 0.000045 | 7.097 |
| Alaska | AK | 0.003419 | 0.000027 | 1.294 |
| Oregon | OR | 0.004162 | 0.000072 | 41.974 |
| Wyoming | WY | 0.004532 | 0.000063 | 6.037 |
| New Hampshire | NH | 0.004837 | 0.000307 | 148.621 |
| Kentucky | KY | 0.00612 | 0.000158 | 112.067 |
...
|
California
| Include Page | ||||
|---|---|---|---|---|
|
...