Predictions
There are many models predicting the short term deaths, in particular, see https://projects.fivethirtyeight.com/covid-forecasts/ for listing and comparing multiple short-term predictions of the number of Americans who will die due to COVID-19. Longer-term, the University of Washington’s Institute for Health Metrics and Evaluation (IHME) released its latest pandemic forecast on September 11, 2020.
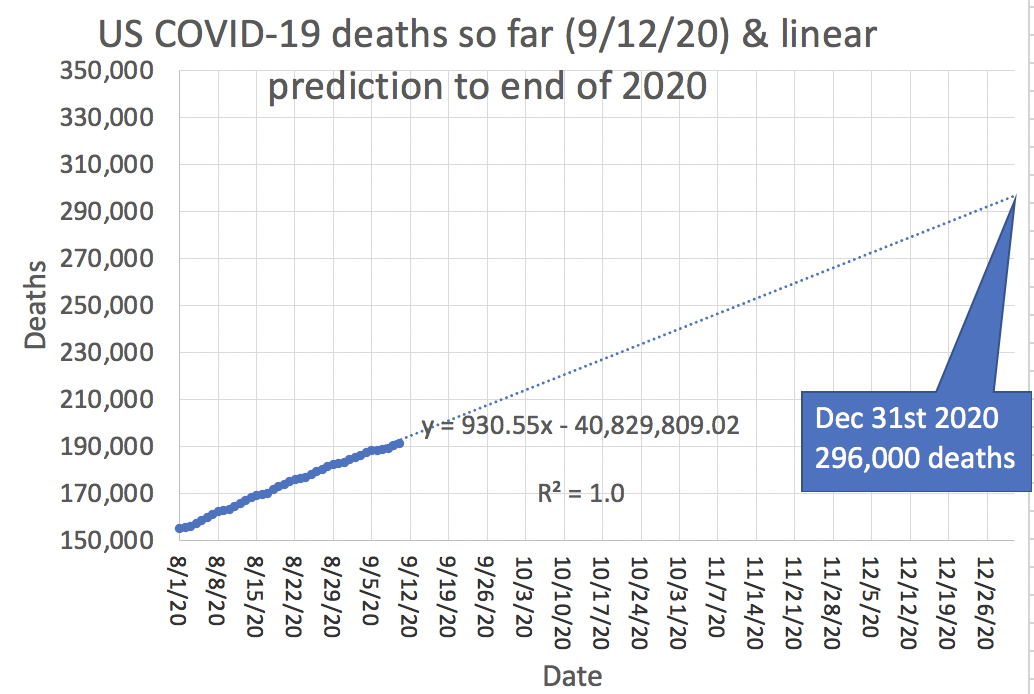
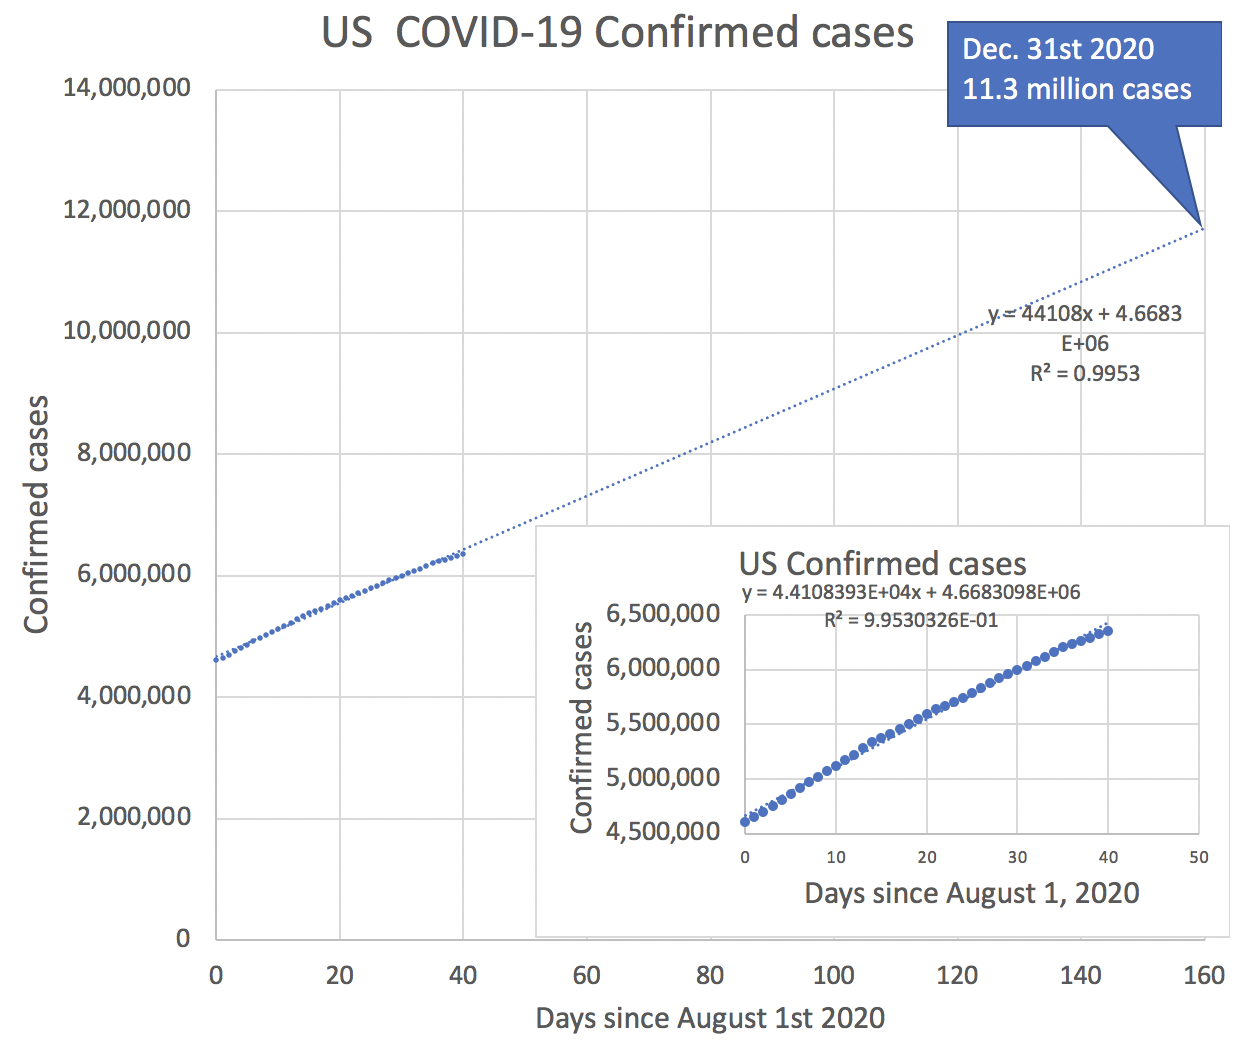
The author's simple linear extrapolations of the COVID19 confirmed cases and deaths for the US between August 1st 2020 and September 10, 2020 from the Johns Hopkins University (JHU) COVID-19 database yield almost 300,000 deaths and 11.3 million confirmed cases by the end of 2020: See http://www.healthdata.org/sites/default/files/files/Projects/COVID/briefing_US_091120.pdf This looks at the current state and the trends in key drivers of transmission (mobility, mask use, testing, and seasonality). They expect the daily death rate in the US, because of seasonality and declining public vigilance, to reach nearly 3,000 a day in December. Cumulative deaths expected by January 1 are 415,090; this is 222,522 deaths from now until the end of the year; or over 120,000 deaths more than the simple linear extrapolation above. The following comments from the forecast are very cogent.Linear Extrapolation
Deaths
Confirmed cases
Spreadsheet
University of Washington pandemic forecast
Top 9 US states by Positivity ratio 9/8/2020

The top 9 states are shown below ranked by their Positivity Rate (from https://coronavirus.jhu.edu/testing/testing-positivity 9/8/2020) together with some demographics and statistics. The smoothing is a 7 day moving average.
- The population is from https://en.wikipedia.org/wiki/List_of_states_and_territories_of_the_United_States_by_population,
- the political leaning is from www.270towin.com updated: Sep. 9, 2020
- the Income per capita is from https://en.wikipedia.org/wiki/List_of_U.S._states_and_territories_by_income.
| State | ID | Population | Positivity | Covid-19 confirmed so far | deaths so far | %deaths/ confirmed | confirmed/ MPop so far | deaths/ MPop so far | smoothed (daily Confirmed/ MPop) | smoothed (daily Deaths/ MPop) | Political leaning | Income per capita ($) |
|---|---|---|---|---|---|---|---|---|---|---|---|---|
| North Dakota | ND | 756927 | 19.58% | 13872 | 156 | 1.12 | 18326.7343 | 206.0965 | 353.3083 | 2.076064 | Safe Republican | 33071 |
| South Dakota | SD | 858469 | 18.73% | 15403 | 173 | 1.12 | 17942.4068 | 201.5215 | 275.2408 | 0.99845539 | Safe Republican | 26959 |
| Alabama | AL | 4858979 | 18.42% | 133606 | 2277 | 1.7 | 27496.7231 | 468.617 | 176.1099 | 2.263850 | Safe Republican | 23606 |
| Kansas | KS | 2911641 | 18.36% | 56854 | 579 | 1.02 | 19526.4457 | 198.8569 | 224.5175 | 2.5513348 | Likely Republican | 27870 |
| Mississippi | MS | 2992333 | 17.28% | 89069 | 2619 | 2.94 | 29765.738 | 875.2368 | 186.0469 | 4.965070 | Safe Republican | 21036 |
| Iowa | IA | 3123899 | 15.31% | 71142 | 1185 | 1.67 | 22773.4635 | 379.3336 | 236.6091 | 2.7438239 | Leaning Republican | 28361 |
| Idaho | ID | 1654930 | 14.78% | 33978 | 389 | 1.14 | 20531.382 | 235.0553 | 140.2735 | 1.8990876 | Safe Republican | 23938 |
| Missouri | MO | 6083672 | 14.5% | 96181 | 1690 | 1.76 | 15809.6952 | 277.7928 | 221.7411 | 3.0057034 | Likely Republican | 26126 |
| Florida | FL | 20271272 | 13.32% | 650092 | 11915 | 1.83 | 32069.6205 | 587.7776 | 134.2646 | 3.8125735 | Tossup | 26582 |
The following charts are obtained from the analysis of the Covid-19 statistics are from the Johns Hopkins University (JHU). There are raw data for confirmed cases and deaths by date for each county in each US state. For the US state analysis, the data from the counties are aggregated into the values for each state.
Cumulative confirmed cases Click on chart for more details | Cumulative deaths Click on chart for more details |
|---|---|
 |  |
Covid-19 % deaths/confirmed cases Click on chart for more details | Covid-19 confirmed cases per million population Click on chart for more details | Covid-19 deaths per million population Click on chart for more details |
|---|---|---|
 |  |  |
Covid-19 smoothed confirmed cases per day per million population Click on chart for more details | Covid-19 smoothed deaths per day per million population Click on chart for more details |
|---|---|
 |  |
Details about the timelines, government resposes to, and impact of Covid-19 on the US states can be found via https://en.wikipedia.org/wiki/Category:COVID-19_pandemic_in_the_United_States_by_state. It is not hard to believe that some of the surges are related to events, behaviors, interventions, and responses. For example:
- In South Dakota, the surge of confirmed cases in July following the July 3rd Mount Rushmore Independence Day celebration. This in turn was followed by a spike in confirmed cases following the Sturgis motorcycle rally August 7-16.
Observations:
- Florida reported its first cases 3/3/20 and its first death 3/8/20, the latter date being the same day that Kansas and Missouri announced their first confirmed cases. None of the other 6 states had any confirmed cases by this date.
- As would be expected since Florida has over three times the population of any of the other states, its confirmed cases and. deaths lead the way by a wide margin.
- In terms of deaths/confirmed cases, Missouri led until the end of July when Mississippi took the lead.
- When one normalizes cases by the population of each state, then the confirmed cases and deaths are more evenly spread, and none of the states has flattened its curve of confirmed cases.
- Idaho appears to have managed to flatten its curve of deaths/million population after 5/11/20 until 7/15/20 when it took off again.
- Florida, Mississippi, and Alabama appear to have a peak in daily confirmed cases two to three weeks after the July 4th holiday. There is a further rise in daily confirmed cases for North and South Dakota, Iowa, and Alabama towards the end of August.
Possible Impact of US presidential campaign rallies
Method
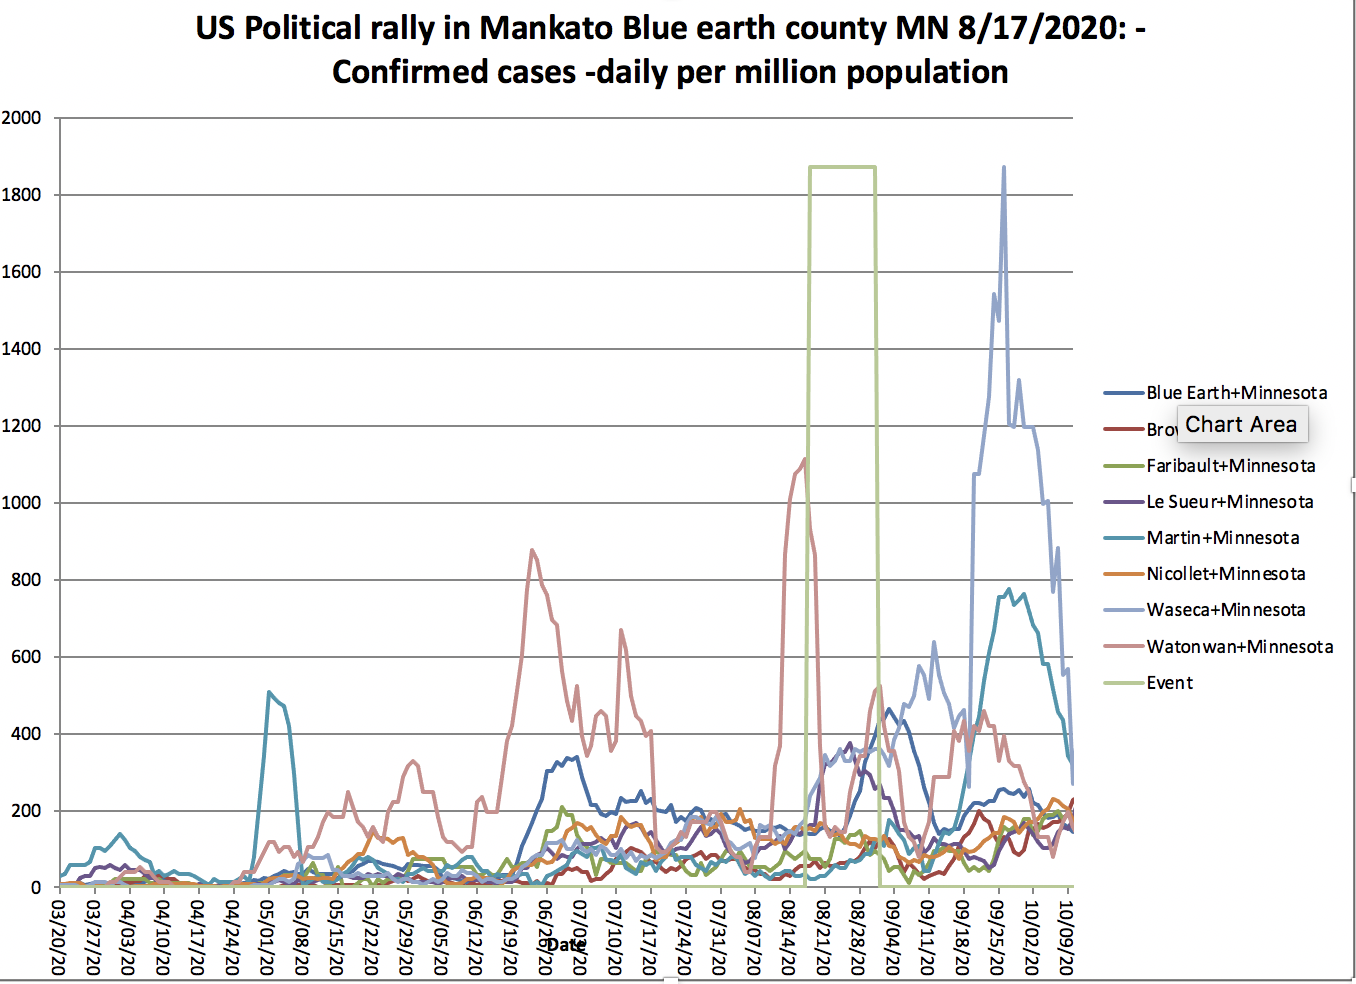
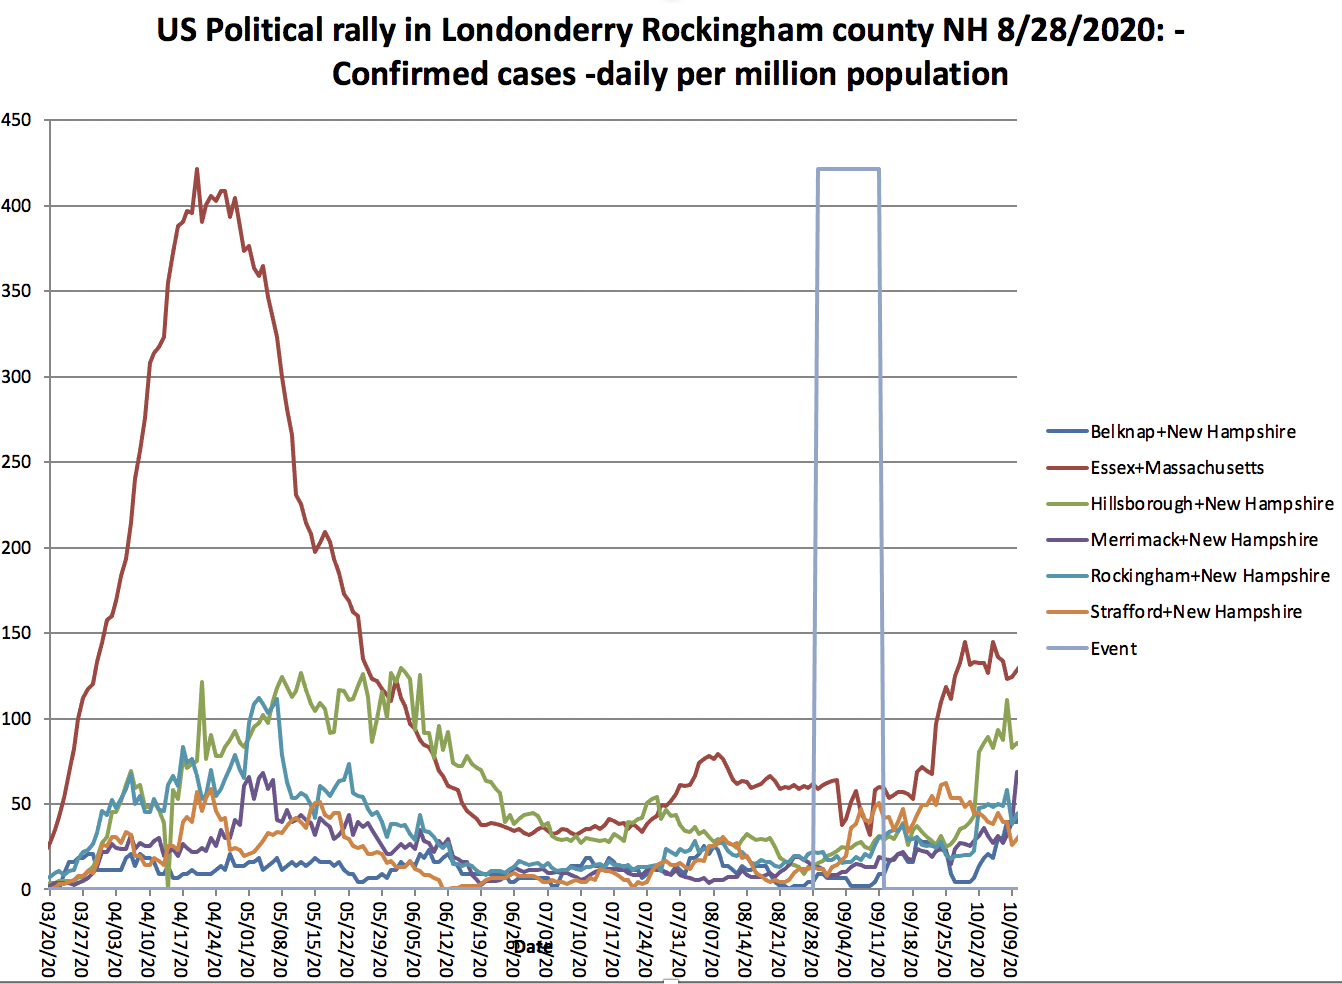
We are interested in whether some of these events may have served as 'super-spreader' events.
The raw data we analyze is the Johns Hopkins University daily confirmed cases data for the US available at: https://raw.githubusercontent.com/CSSEGISandData/COVID-19/master/csse_covid_19_data/csse_covid_19_time_series/time_series_covid19_confirmed_US.csv
The question is whether there was a significant rise in daily confirmed Covid-19 cases after the rally, in particular in the 2-14 days following the rally (according to the CDC, Sep 18, 2020: "Symptoms may appear 2-14 days after you were exposed to COVID-19").
We have not analyzed the more recent rallies following President Trump's experimental treatment at the Walter Reed hospital for the virus, since there is insufficient delay compared to the 14 day incubation period, to clearly identify a rally's impact.
The social distancing at the rallies was minimal, and not everyone wore masks, see for example, the photos below taken at the Oshkosh rally.
|
|


Results
The links "Details in Excel file" in the table below (derived from https://en.wikipedia.org/wiki/List_of_post-election_Donald_Trump_rallies), provide access to Excel worksheets and charts of daily confirmed cases for each county plus identification of the event's starting date followed by a 14 day incubation period.
On clicking the "Details in Excel file" link it will prove access to the Excel workbook. On opening the workbook, open the Chart1 tab. You can move the mouse over a chart's line to get the date, value and county for the line.
Date of rally | City | County | State | Venue | Possible impact of rally on daily Confirmed cases in adjacent counties | Observations |
|---|---|---|---|---|---|---|
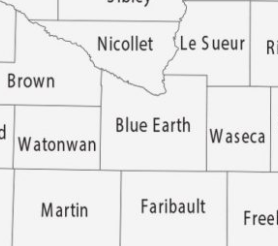
| Monday, August 17, 2020[110] | Mankato | Blue Earth County | MN | Mankato Regional Airport | Blue Earth sees a rise in cases 10 days after the rally. Brown sees a rise in cases 26 days after the rally. Faribault sees a rise in cases around 12-14 days after the rally. Le Sueur sees a rise in cases 3-4 days after the rally that rises to a peak after 11-12 days after the rally and then falls. We assume this not likely to be | |
| Monday, August 17, 2020[111] | Oshkosh | Winnebago County | WI | Oshkosh airway | Fond Du Lac, Outagamie and Winnebago's daily confirmed cases roughly doubled 12 days after the rally, and continued to rise. Follwing the nd of the 14 day incubation period there is a pronounced rise in daily confirmed cases for all counties. | |
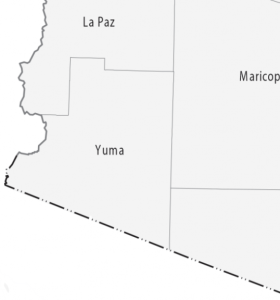
| Tuesday, August 18, 2020[112] | Yuma | Yuma County | AZ | Joe Foss Hangar | No apparent impact. | |
| Thursday, August 20, 2020[113] | Old Forge | Lackawanna County | PA | Mariotti Building Products | There are significant rises in the number of cases in the 2-14 days after the event on 8/20/20.
| |
| Friday, August 28, 2020[114] | Londonderry | Rockingham County | NH | Pro Star Aviation | There is a rise in confirmed cases for all counties except Essex, 5-14 days following the rally. Essex starts to climb 22 days after the rally. | |
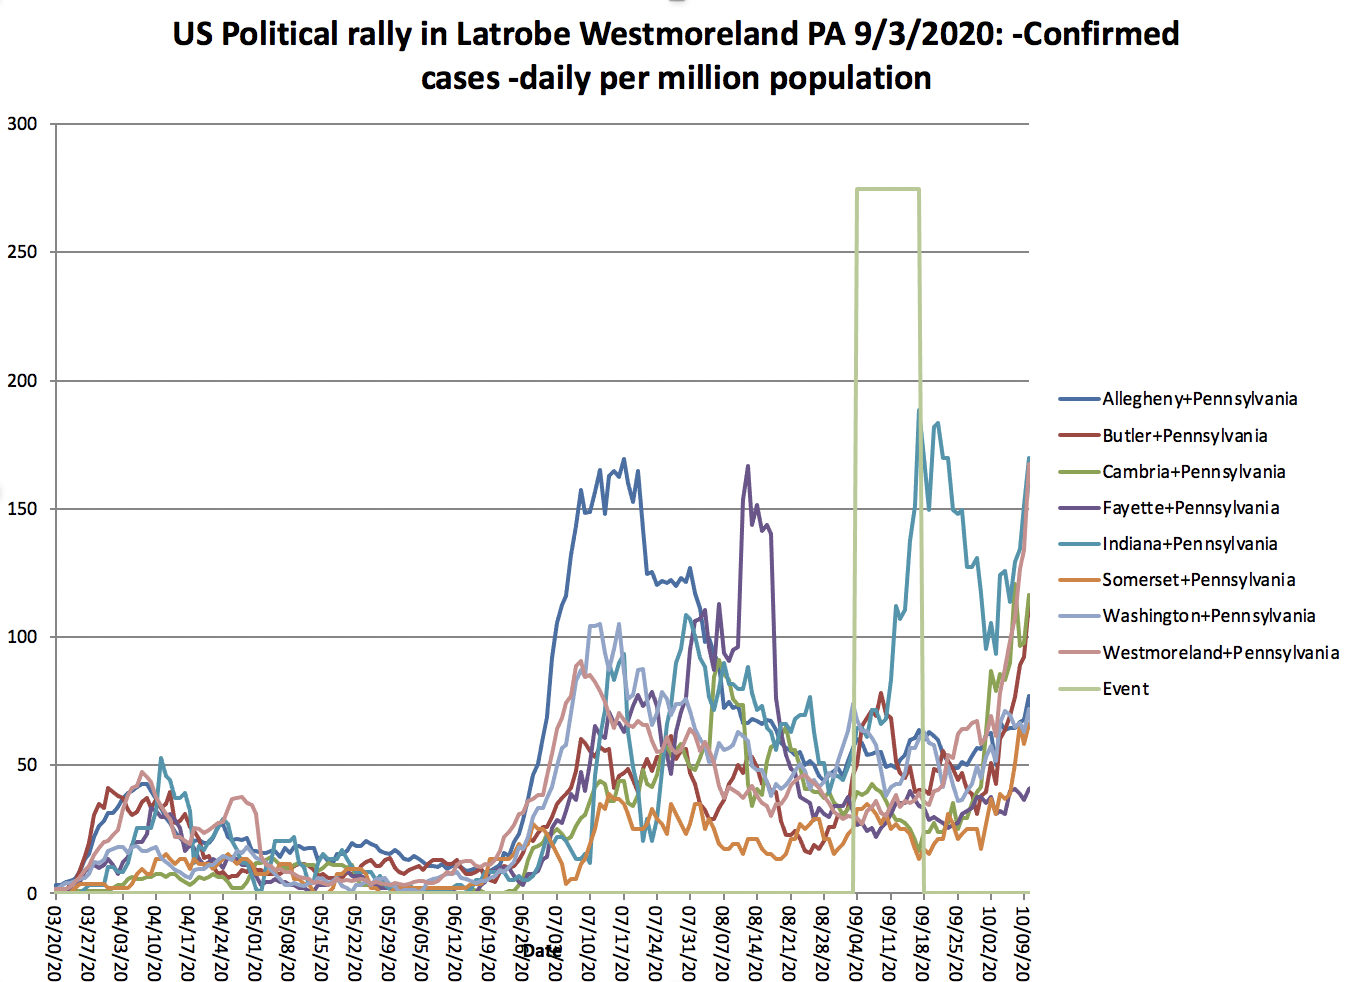
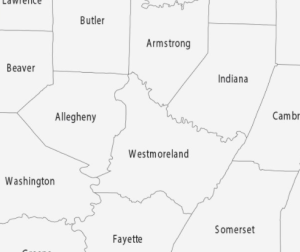
| Thursday, September 3, 2020[115] | Latrobe | Westmoreland County | PA | Arnold Palmer Regional Airport | Steep rise of cases in Indiana county, no apparent increase in other counties. | |
| Tuesday, September 8, 2020[116] | Winston-Salem | Forsyth County | NC | Smith Reynolds Airport |
| There is a steep rise in daily confirmed cases following the 14 day incubation period. |
| Thursday, September 10, 2020[117] | Freeland | Saginaw County | MI | Avflight Saginaw | There is a slow rise in daily confirmed cases starting in the 14 day incubation period and continuing afterwards | |
| Saturday, September 12, 2020[118] | Indoors | Douglas County | NV | Minden-Tahoe Airport | There is a rise in cases in 4 of the 5 counties starting a few days after the rally. | |
| Sunday, September 13, 2020[119] | Henderson | Clark County | NV | Xtreme Manufacturing | Clark, Mohave, and Nye counties all see a rise in confirmed cases starting between the 17th and 20th of September. | |
| Friday, September 18, 2020[120] | Bemidji | Beltrami County | MN | Bemidji Aviation Services | There is a pronounced rise in the daily confirmed cases that starts in the incubation period and continues afterwards. | |
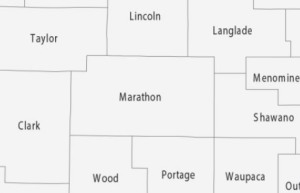
| Friday, September 18, 2020[121] | Mosinee | Marathon County | WI | Central Wisconsin Aviation | In this case, the rise in cases starts before the rally. |


| Date of Rally | City | County | State | Venue | Possible impact of rally on daily Confirmed cases in adjacent counties | Observations |
|---|---|---|---|---|---|---|
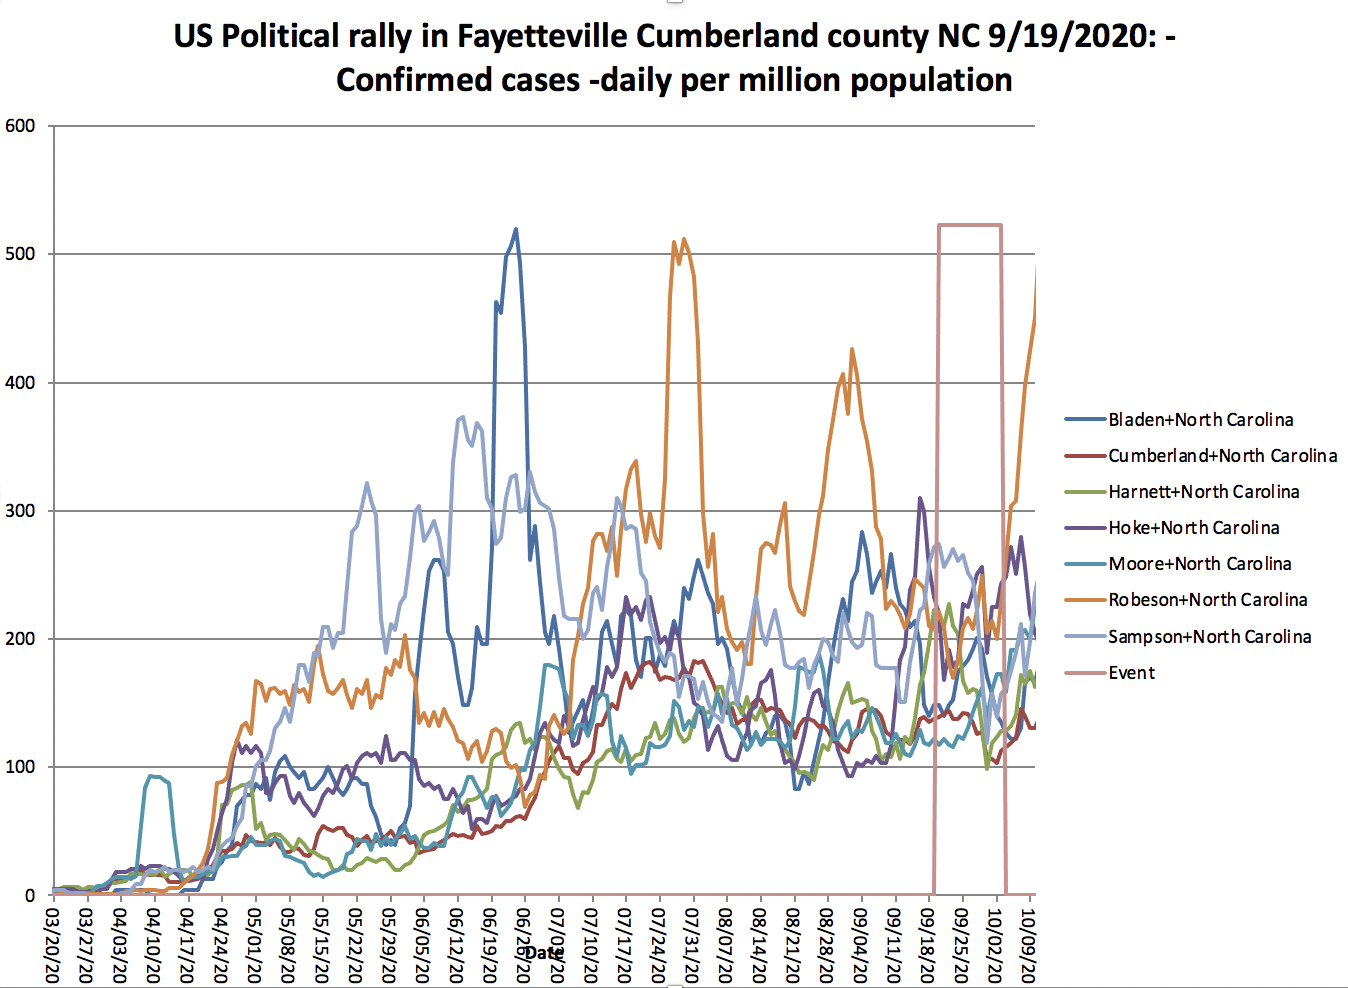
| Saturday, September 19, 2020[123] | Fayetteville | Cumberland | NC | Fayetteville Regional Airport | Several counties such as Hoke, Simpson, Hartnett, Moore and especially Robeson have an uptick of confirmed cases around the end of the incubation period. | |
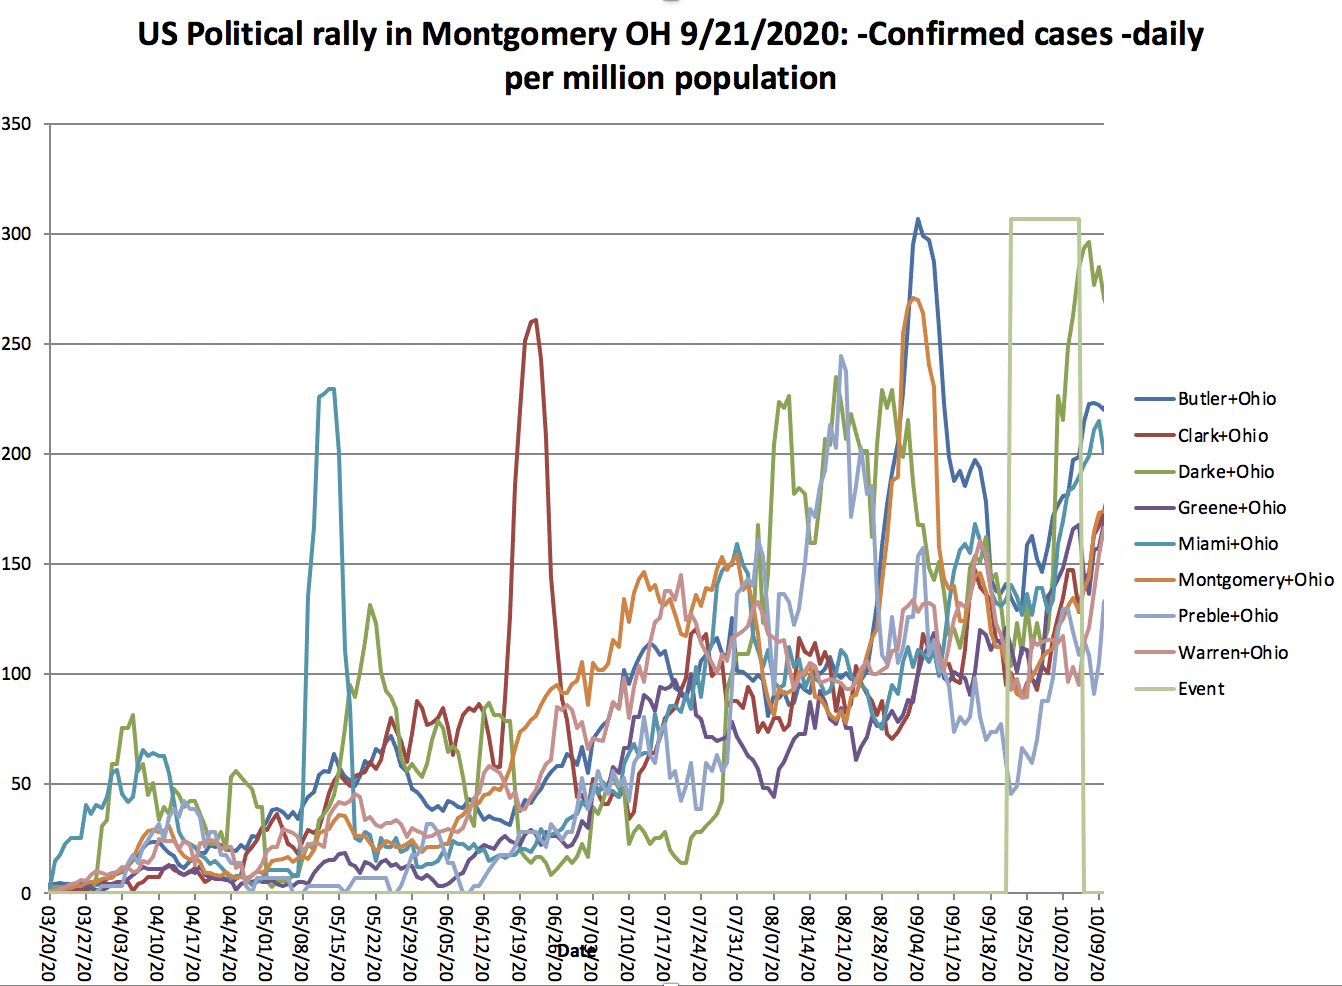
| Monday, September 21, 2020[124] | Vandalia | Montgomery | OH | Dayton International Airport | All counties experience an uptick in daily confirmed cases during the incubation period. | |
| Swanton | Fulton & Lucas | Toledo Express Airport | Most counties experience an uptick in confirmed daily cases during the incubation period. | |||
| Tuesday, September 22, 2020[125] | Pittsburgh | Alleghany | PA | Pittsburgh International Airport | Most counties experience an uptick in confirmed daily cases during the incubation period. | |
| Thursday, September 24, 2020[126] | Jacksonville | Duval | FL | Cecil Airport | There is no noticeable impact. | |
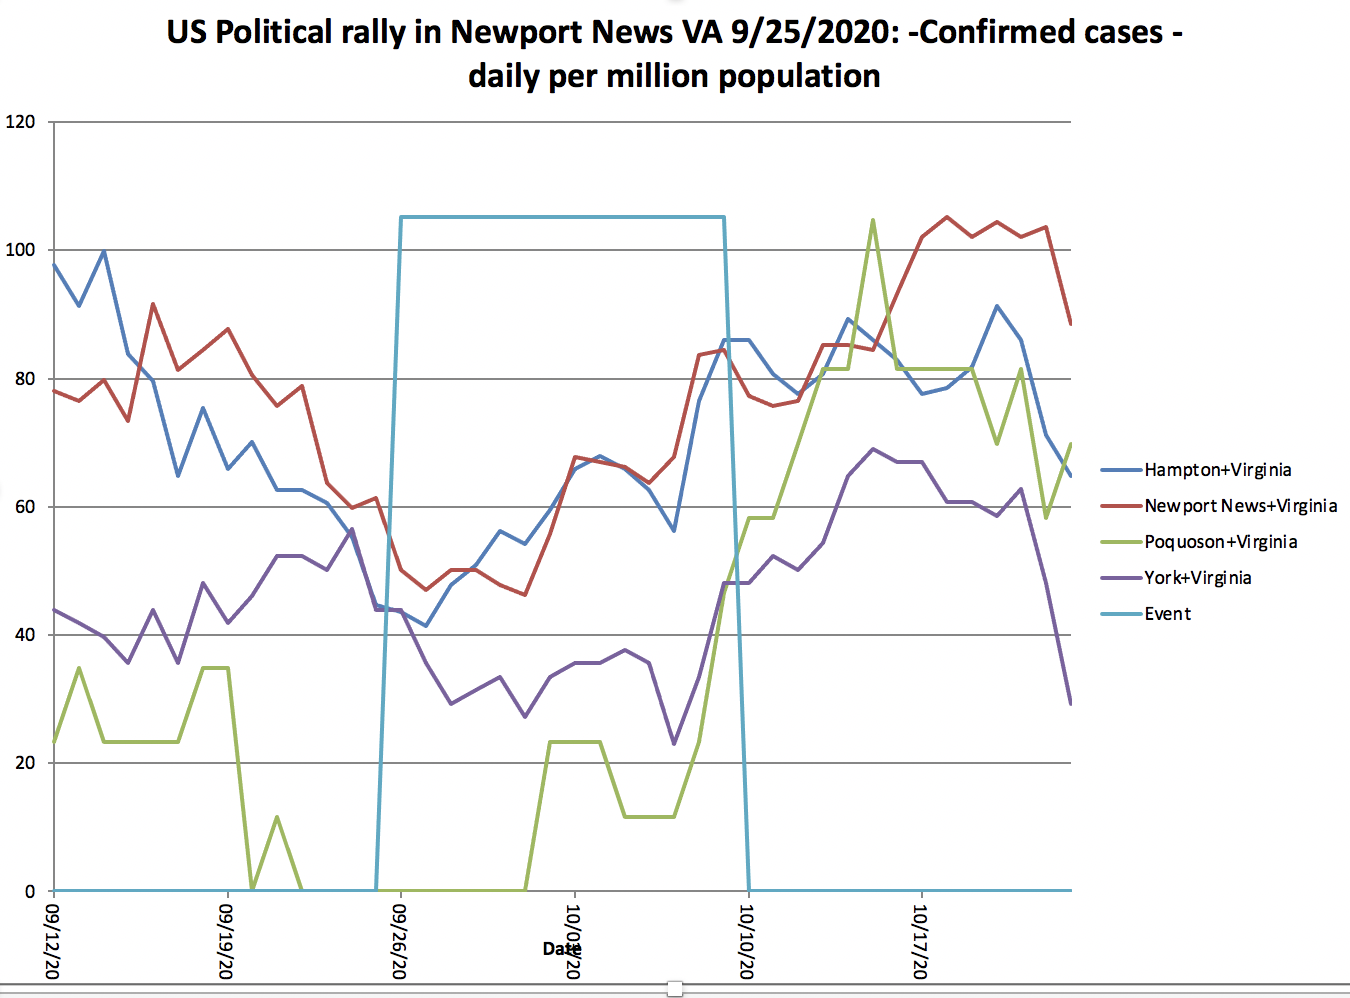
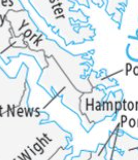
| Friday, September 25, 2020[127] | Newport News | Warwick | VA | Newport News/Williamsburg International Airport |
| Cases start to rise in all counties during and after the 14 day quaratine period following the rally. |
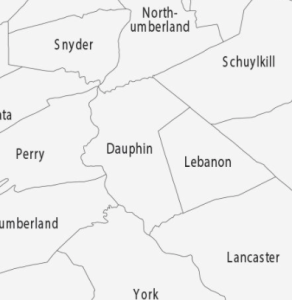
| Saturday, September 26, 2020[128] | Middletown | Dauphin | PA | Harrisburg International Airport | Most counties experience an uptick in confirmed daily cases during the incubation period. | |
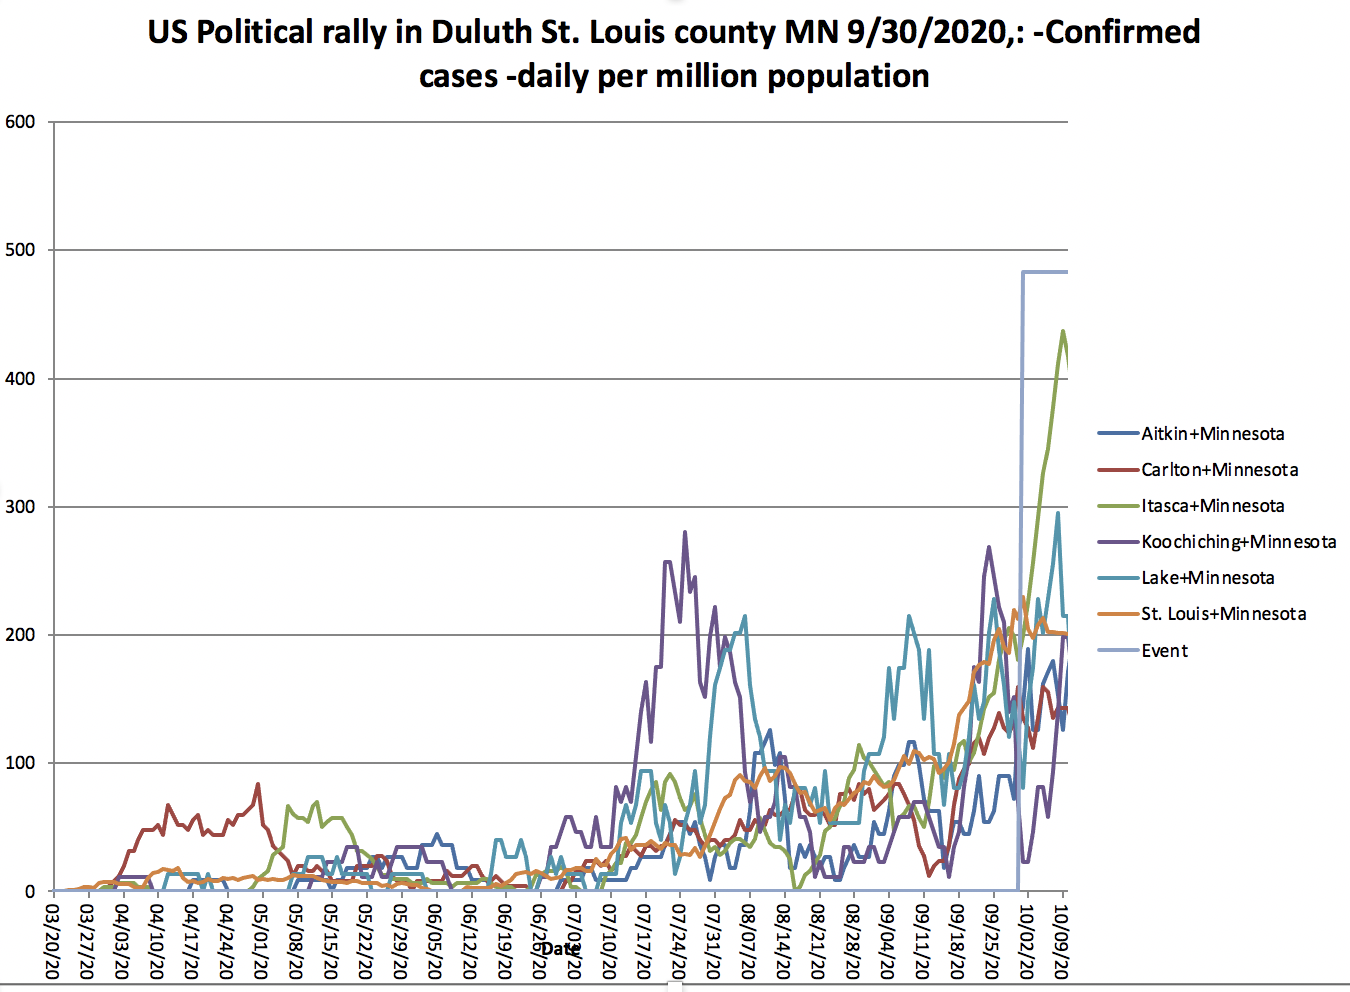
| Wednesday, September 30, 2020[129] | Duluth | St Louis | MN | Duluth International Airport | Most counties experience an uptick in confirmed daily cases during the incubation period. | |
| Monday, October 12, 2020[130] | Sanford | Seminole | FL | Orlando Sanford International Airport | ||
| Tuesday, October 13, 2020[131] | Johnstown | Cambria | PA | John Murtha Johnstown-Cambria County Airport | ||
| Wednesday, October 14, 2020[131] | Des Moines | Iowa | IA | Des Moines International Airport | ||
| Thursday, October 15, 2020[132] | Greenville | Pitt | NC | Pitt-Greenville Airport | ||
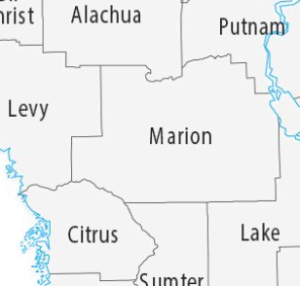
| Friday, October 16, 2020[133] | Ocala | Marion | FL | Ocala International Airport | ||
| Macon | Leon | GA | Middle Georgia Regional Airport | |||
| Saturday, October 17, 2020[134] | Muskegon | Muskegon | MI | Muskegon County Airport | ||
| Janesville | Rock | WI | Southern Wisconsin Regional Airport | |||
| Sunday, October 18, 2020[135] | Carson City | Carson City | NV | Carson City Airport | ||
| Monday, October 19, 2020[136] | Prescott | Yavapai | AZ | Prescott Regional Airport | ||
| Tucson | Tuscon | Tucson International Airport | ||||
| Tuesday, October 20, 2020[137] | Erie | Erie | PA | Erie International Airport | ||
| Wednesday, October 21, 2020[138] | Gastonia | Gaston | NC | Gastonia Municipal Airport | ||
| Friday, October 23, 2020[139] | The Villages | Sumter | FL | The Villages Polo Club | ||
| Pensacola | Escambia | Pensacola International Airport | ||||
| Saturday, October 24, 2020 | Lumberton | Robeson | NC | Robeson County Fairgrounds | ||
| Circleville | Pickaway | OH | Pickaway Agriculture and Event Center | |||
| Waukesha | Waukesha | WI | Waukesha County Airport | |||
| Sunday, October 25, 2020 | Manchester | Hillborough | NH | Manchester-Boston Regional Airport |


The Excel files come from a library of Excel workbooks illustrating the impact of COVID-19 on many different areas of the world.
Possibly Impacted counties
We looked at the adjacent counties in the same state or neighboring state (using https://gisgeography.com/us-county-map/) where we see the following counties.
Douglas County NV 9/12/20 | Clark County NV 9/13/20 | Winnebago WI 8/17/20 | Blue Earth MN 8/17/20 | Lackawanna PA 8/20/20 | Rockingham NH 8/26/20 |
|
|
|
|
|
|


| Marathon County WI 9/17/2020 | Yuma county AZ 8/18/2020 | Westmoreland PA 9/3/2020 | Forsyth NC 9/8/2020 | Saginaw MI 9/10/2020 | Beltrami County MN 9/18/2020 |
|---|---|---|---|---|---|
|
|
|
|
|
|


| Cumberland NC 9/19/20 | Montgomery OH 9/21/20 | Fulton & Lucas OH 9/21/2020 | Allegheny PA 9/22/2020 | Duval FL 9/24/20 | Newport News VA 9/25/2020 |
|---|---|---|---|---|---|
|  |
|
|
|
|


| Dauphin Philadelphia 9/26/2020 | St. Louis MN 9/30/2020 | Seminole FL 10/12/2020 | Cambria PA 10/13/2020 | Des Moines IA 10/14/2020 | Pitt NC 10/15/2020 |
|---|---|---|---|---|---|
|
|
|
|
|
|


| Marion FL 10/16/2020 | Muskegon MI 10/17/2020 | Rock Wi 10/18/2020 | Carson City NV 10/18/2020 | Yavapai NV, 10/19/2020 | Tuscon Pima County AZ, 10/19/2020 |
|---|---|---|---|---|---|
|
|
|
|
|
|


Also see
- https://time.com/5865890/oklahoma-covid-19-trump-tulsa-rally/
- https://www.axios.com/trump-rally-fined-violating-covid-guidelines-1566236b-0177-4407-b139-a7f69c11db66.html
- https://thenevadaindependent.com/article/nevada-health-officials-predict-uptick-in-covid-19-cases-following-labor-day-weekend-crowds-trump-rallies
- https://www.usatoday.com/story/news/investigations/2020/10/22/trumps-campaign-made-stops-nationwide-then-coronavirus-cases-surged/3679534001/
US States time series plots of Covid-19 cases, May-June
- time series plot of the US Confirmed cases by state on a log scale.
- percent deaths/confirmed cases by state as a function of date:
US States Motion Charts of Covid-19 deaths vs confirmed cases
Cumulative:
- cases with bubbles sized by US state population and colored by per capita income (Jan 28, 2020 - Apr 28, 2000)
- cases per million population with bubbles sized by US state population (May 1, 2020 - Jun 22, 2020)
- cases per million population with bubbles sized by US state population and colored by per capita income (May 1, 2020, Jun 25, 2020)
- cases with bubbles sized by population density of state and colored by per capita income (May 1 2020 - Jun 26, 2020)
- March 1, 2020 - July 20, 2020
Motion Charts with bubbles sized by US state population and colored by per capita income Mar 1, 2020 thru Jul 20
US State population > 10 Million population US State population 6-10 Million population US States 3-6 Million population US States 1.3-3M population 


US by state + DC every 5 days color=income US by state + DC every 4 days color=%Hispanic+Black 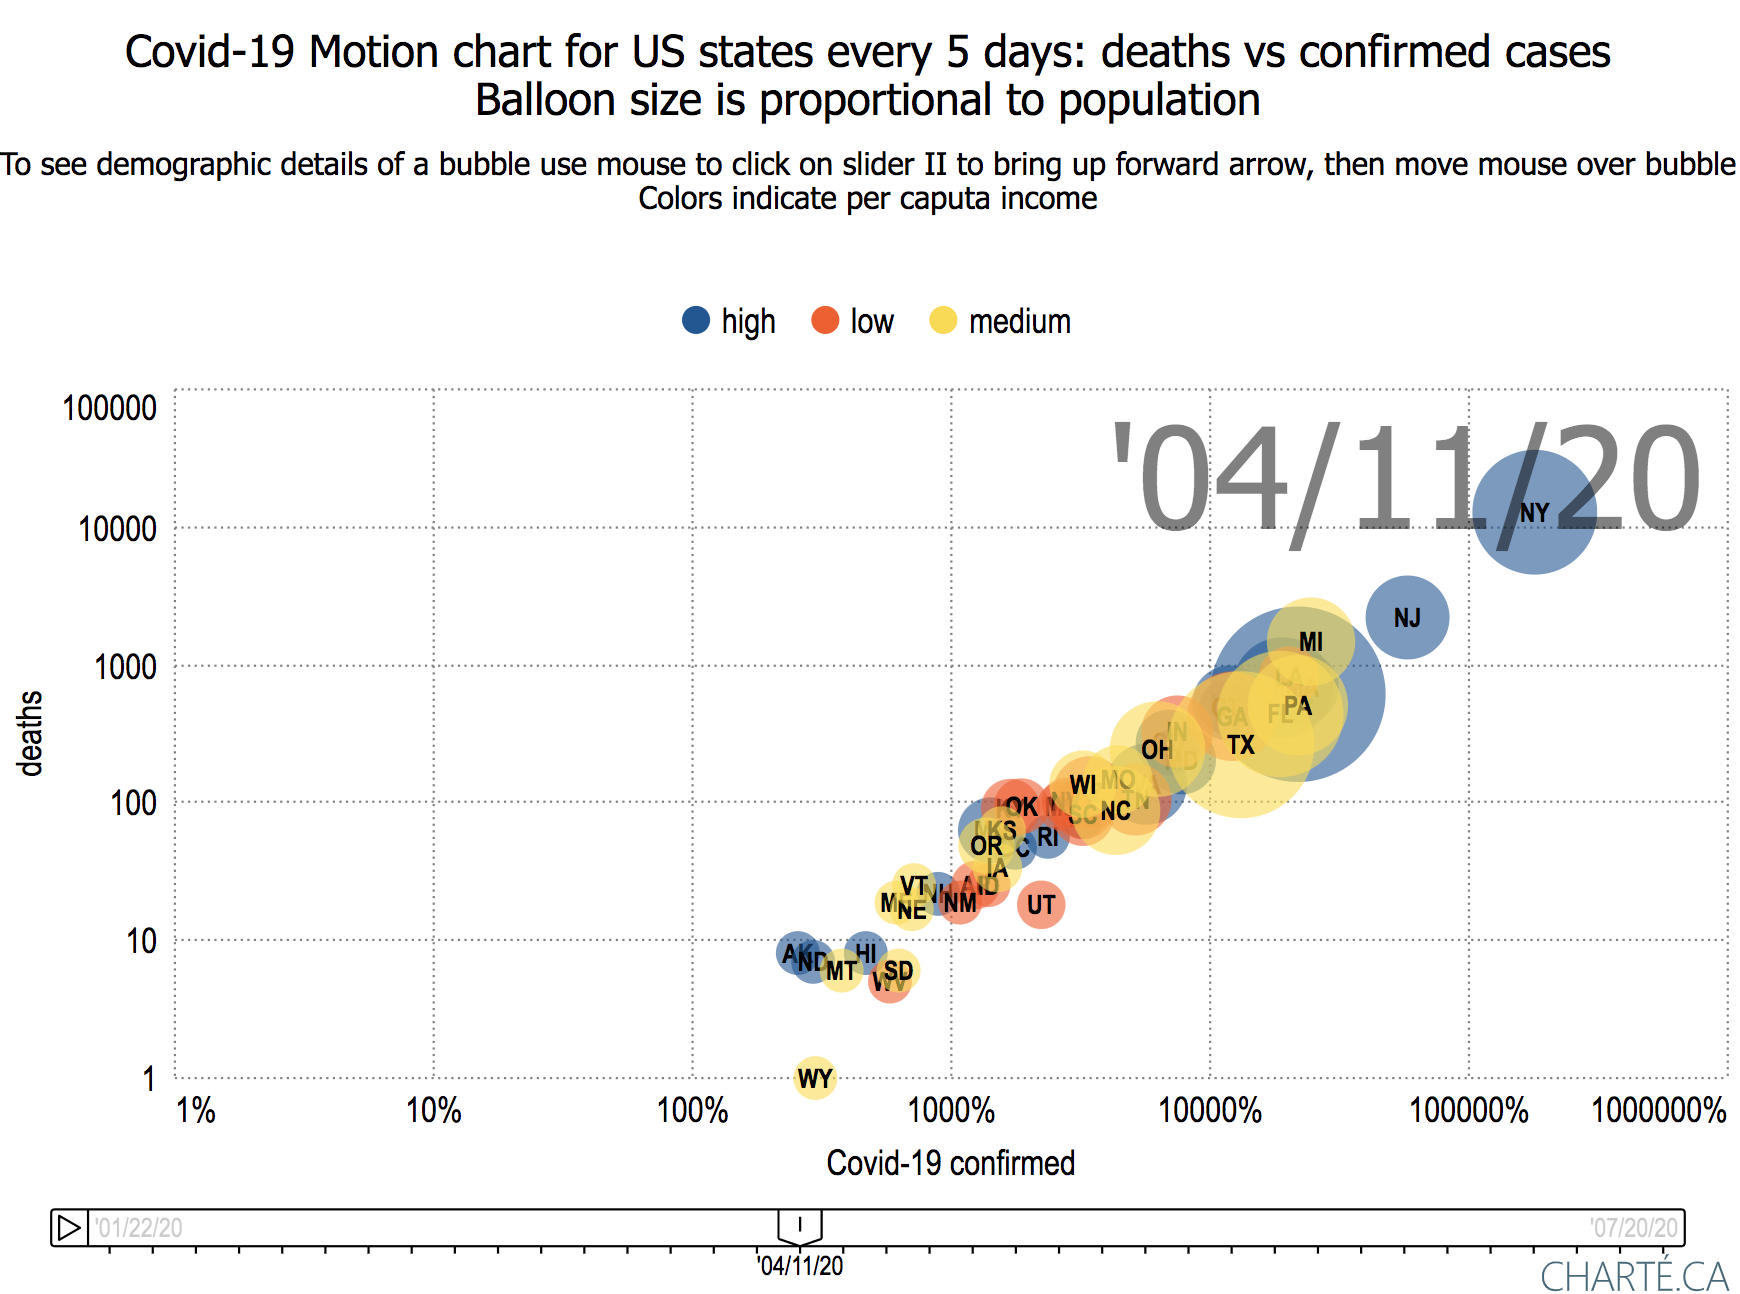


Daily:
- daily cases per million population with bubbles sized by US state population and colored by per capita income (May 1, 2020, Jun 26, 2020)
- cases with bubbles sized by US state population and colored by per capita income (May 1, 2020, Jun 26, 2020)
Observations
- Looking at the total deaths vs cases it is seen that New York (NY), Delaware (DE), Massachusetts (MA), Rhode Island (RI) and Connecticut (CT) lead the pack followed by Maryland (MD), Illinois (IL) and more recently Louisiana (LA) but other states are catching up.
- It is a similar situation when one normalizes the states by their populations.
- When one looks at the new daily confirmed cases/Million state population and deaths/Million state population it is seen to be very variable day-to-day.
- Arizona's increased confirmed cases pulled it away from the pack starting May 14, 2020, and Florida pulled away starting May 24, 2020
- The values of new Confirmed cases/day/Million State population appears to decrease as one moves forward in time beyond May 23 but then to increase again (driven by Arizona) starting June 14, 2020. Maybe this is part of the "opening".
- Comparing the above with the same data but not normalized by state population
- At the start of May there is a noticeable correlation between deaths and confirmed, by the end of June the correlation is much weaker
- At the start of May the deaths and confirmed is dominated by New York (NY), New Jersey (NJ), Illinois (IL), Massachusetts (MA), California (CA) and Maryland (MD). By the end of June California (CA)is still a leader joined by Texas (TX), Florida (FL), Arizona (AZ), and Georgia (GA).
- Looking at the cases with bubbles sized by population density:
- Some states with high population densities such as New York (NY), New Jersey (NJ) and Massachusetts (MA) have high numbers of confirmed cases while others such as Washington DC, Rhode Island (RI), Delaware (DE) have fairly low numbers of confirmed cases.
- In general, the deaths/confirmed cases appear to be falling with time for especially as we get into June. This may be a mixture of increased testing finding more cases as well as more effective treatment.
- Exceptions that are still increasing include: NJ, MA, PA, CT, SD, NH, IL.
- Jul 22 California passes New York in number of confirmed cases (California population ~ 39M, New York population 20M), New York still has roughly four times California's deaths.
Looking at the July 24, 2020 JHU data there is a strong correlation between the total Confirmed case/state population and the % Hispanic + Black of the state's population.
Confirmed cases/population vs % Hispanic & Black (bubble sizes proportional to state's population) Confirmed cases/population vs % Black (bubble sizes proportional to state's population) Deaths/population vs % Hispanic + Black (bubble sizes proportional to state's population) 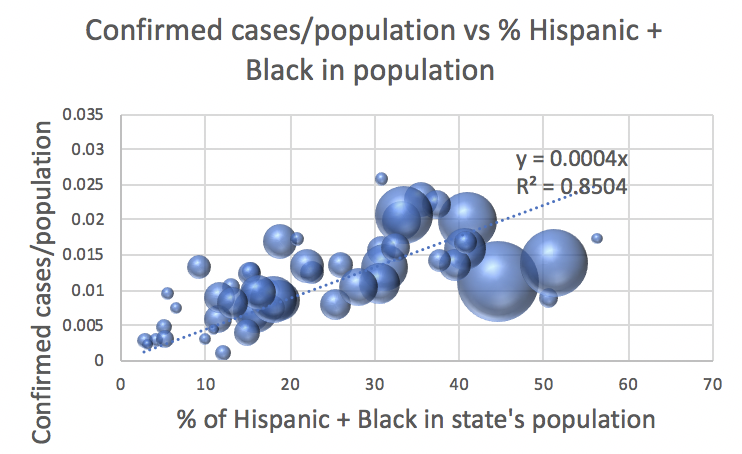


As would be expected there is strong correlation between the number of reported confirmed cases and a state's population and a noticeable correlation between the reported deaths and a state's population.
x axis is the state's population, y axis is the reported Confirmed cases on July 27. x axis is the state's population, y axis is the reported deaths on July 27. 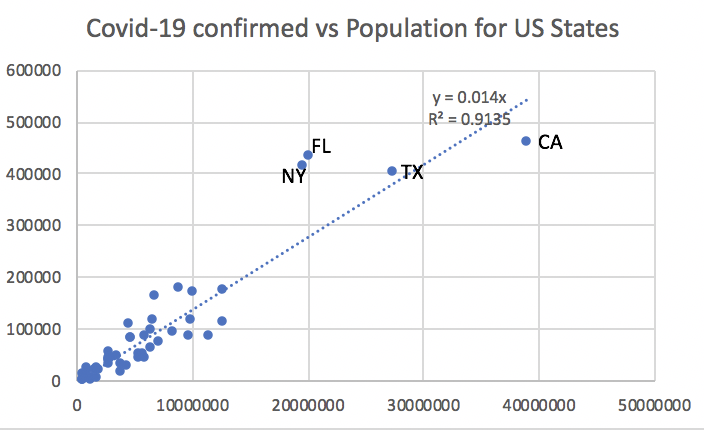

- Confirmed Cases/population
The ten states with the leading confirmed cases/population as of 7/26/2020 were:
State ID confirmed/Pop deaths/Pop Pop-Density(pop/sq-km) Delaware DE 0.026143 0.00143 485.343 Arizona AZ 0.023728 0.000484 60.109 Louisiana LA 0.023032 0.000806 108.109 Florida FL 0.020909 0.000289 378.019 New York NY 0.020799 0.001648 420.061 New Jersey NJ 0.020023 0.001762 1218.114 Mississippi MS 0.01765 0.000502 63.771 District of Columbia DC 0.017524 0.000864 11020.131 Rhode Island RI 0.017253 0.000949 1021.565 Massachusetts MA 0.017019 0.001255 871.08 The lowest ten states were:
State ID confirmed/Pop deaths/Pop Pop-Density(pop/sq-km) Hawaii HI 0.001176 0.000018 222.887 Vermont VT 0.002236 0.000089 67.923 Maine ME 0.002869 0.00009 43.1 West Virginia WV 0.003193 0.000056 76.717 Montana MT 0.003234 0.000045 7.097 Alaska AK 0.003419 0.000027 1.294 Oregon OR 0.004162 0.000072 41.974 Wyoming WY 0.004532 0.000063 6.037 New Hampshire NH 0.004837 0.000307 148.621 Kentucky KY 0.00612 0.000158 112.067 - The number of days from the first confirmed case to the first death was 57 +- 6 days.