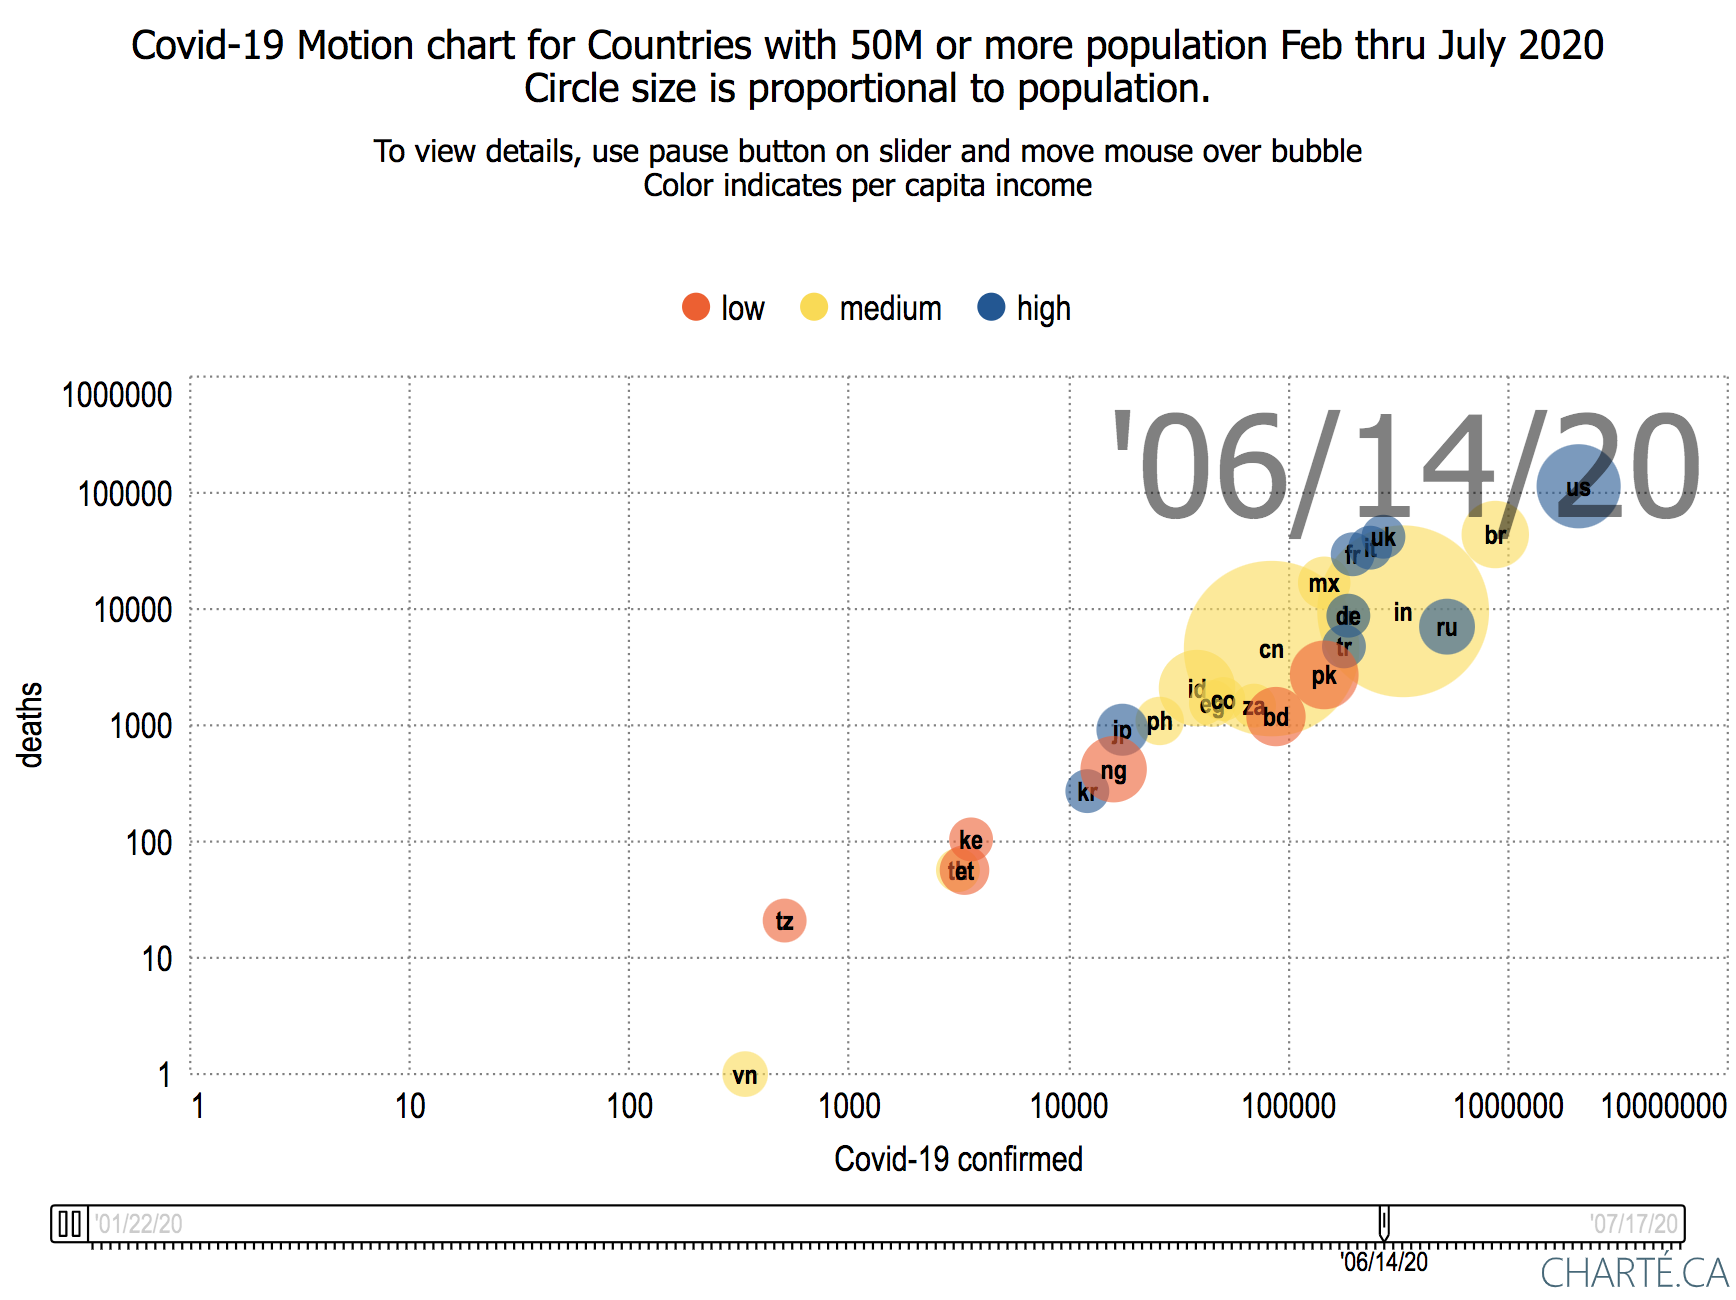
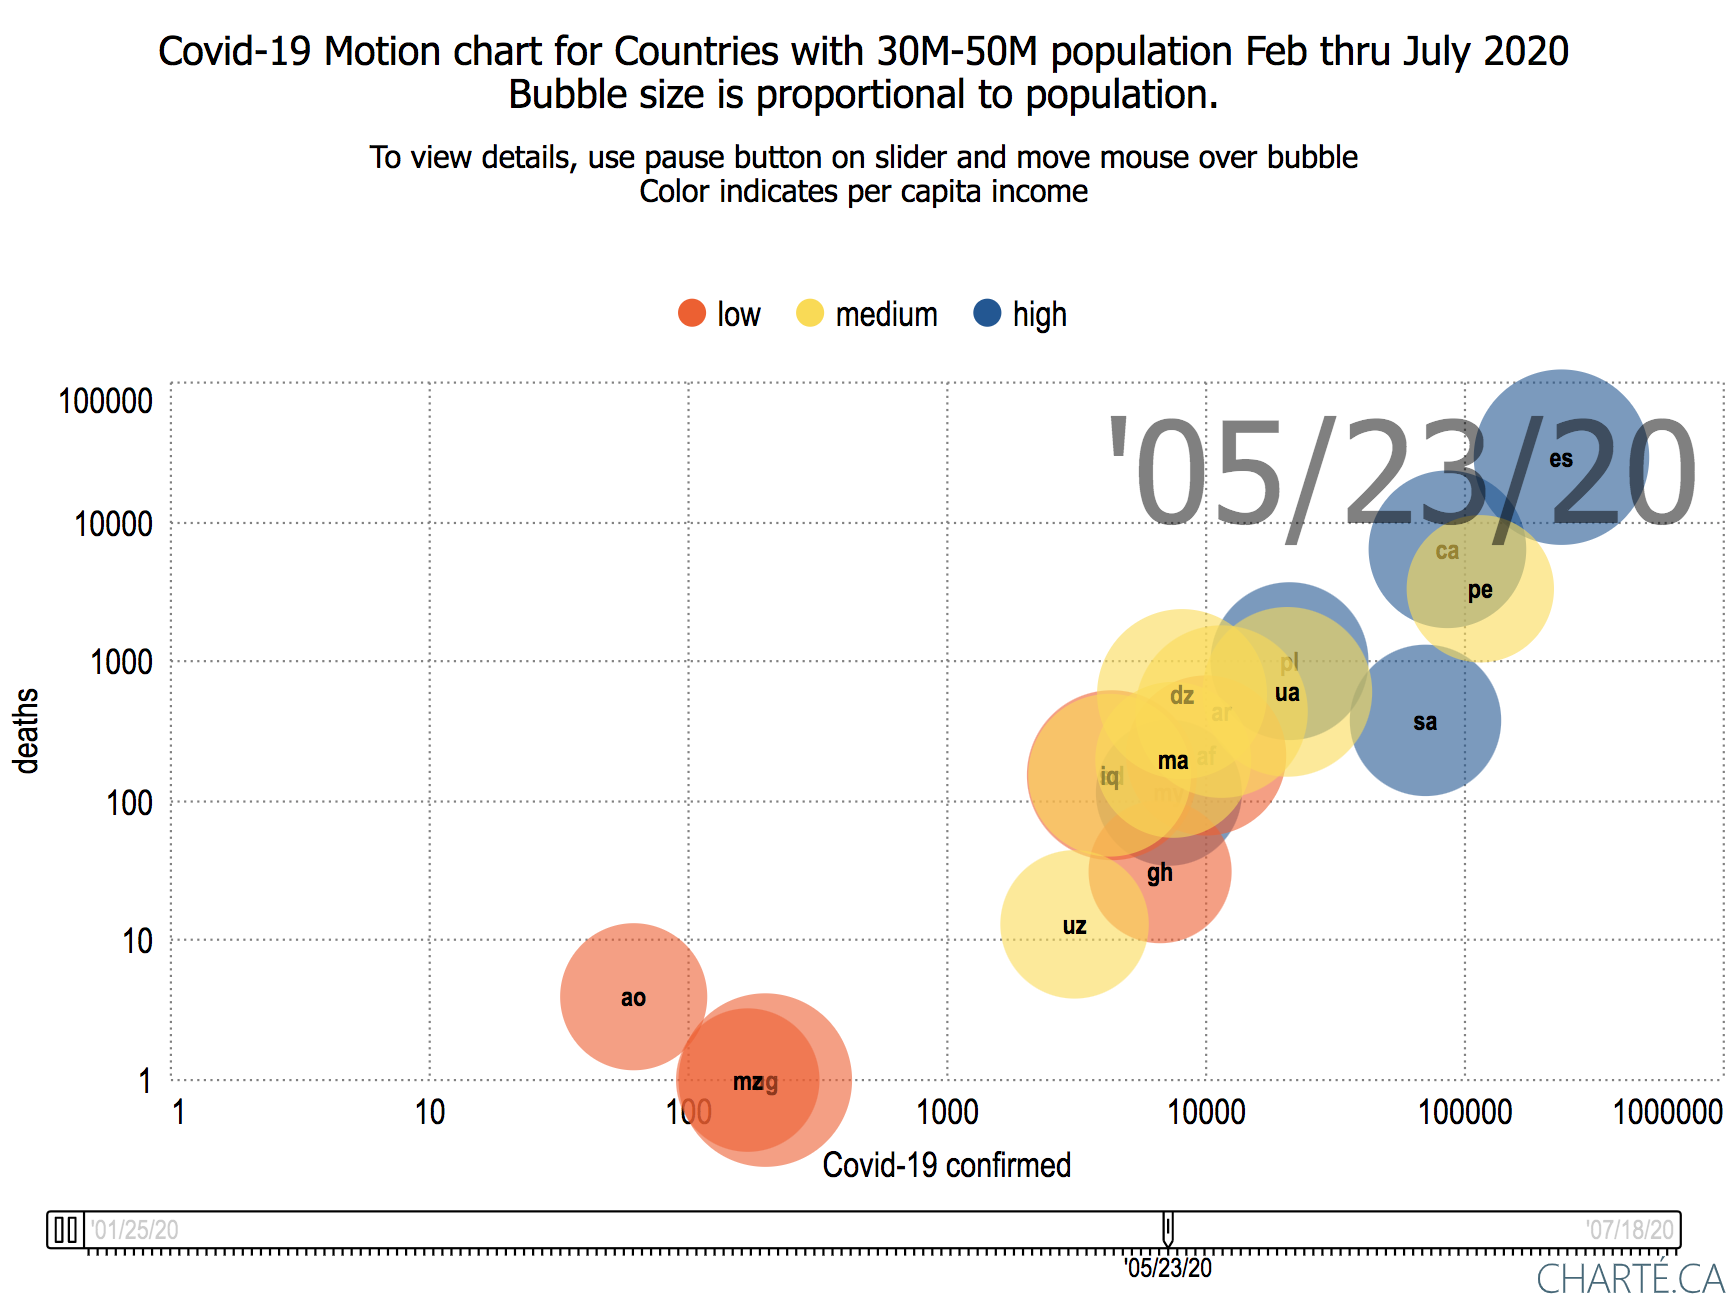
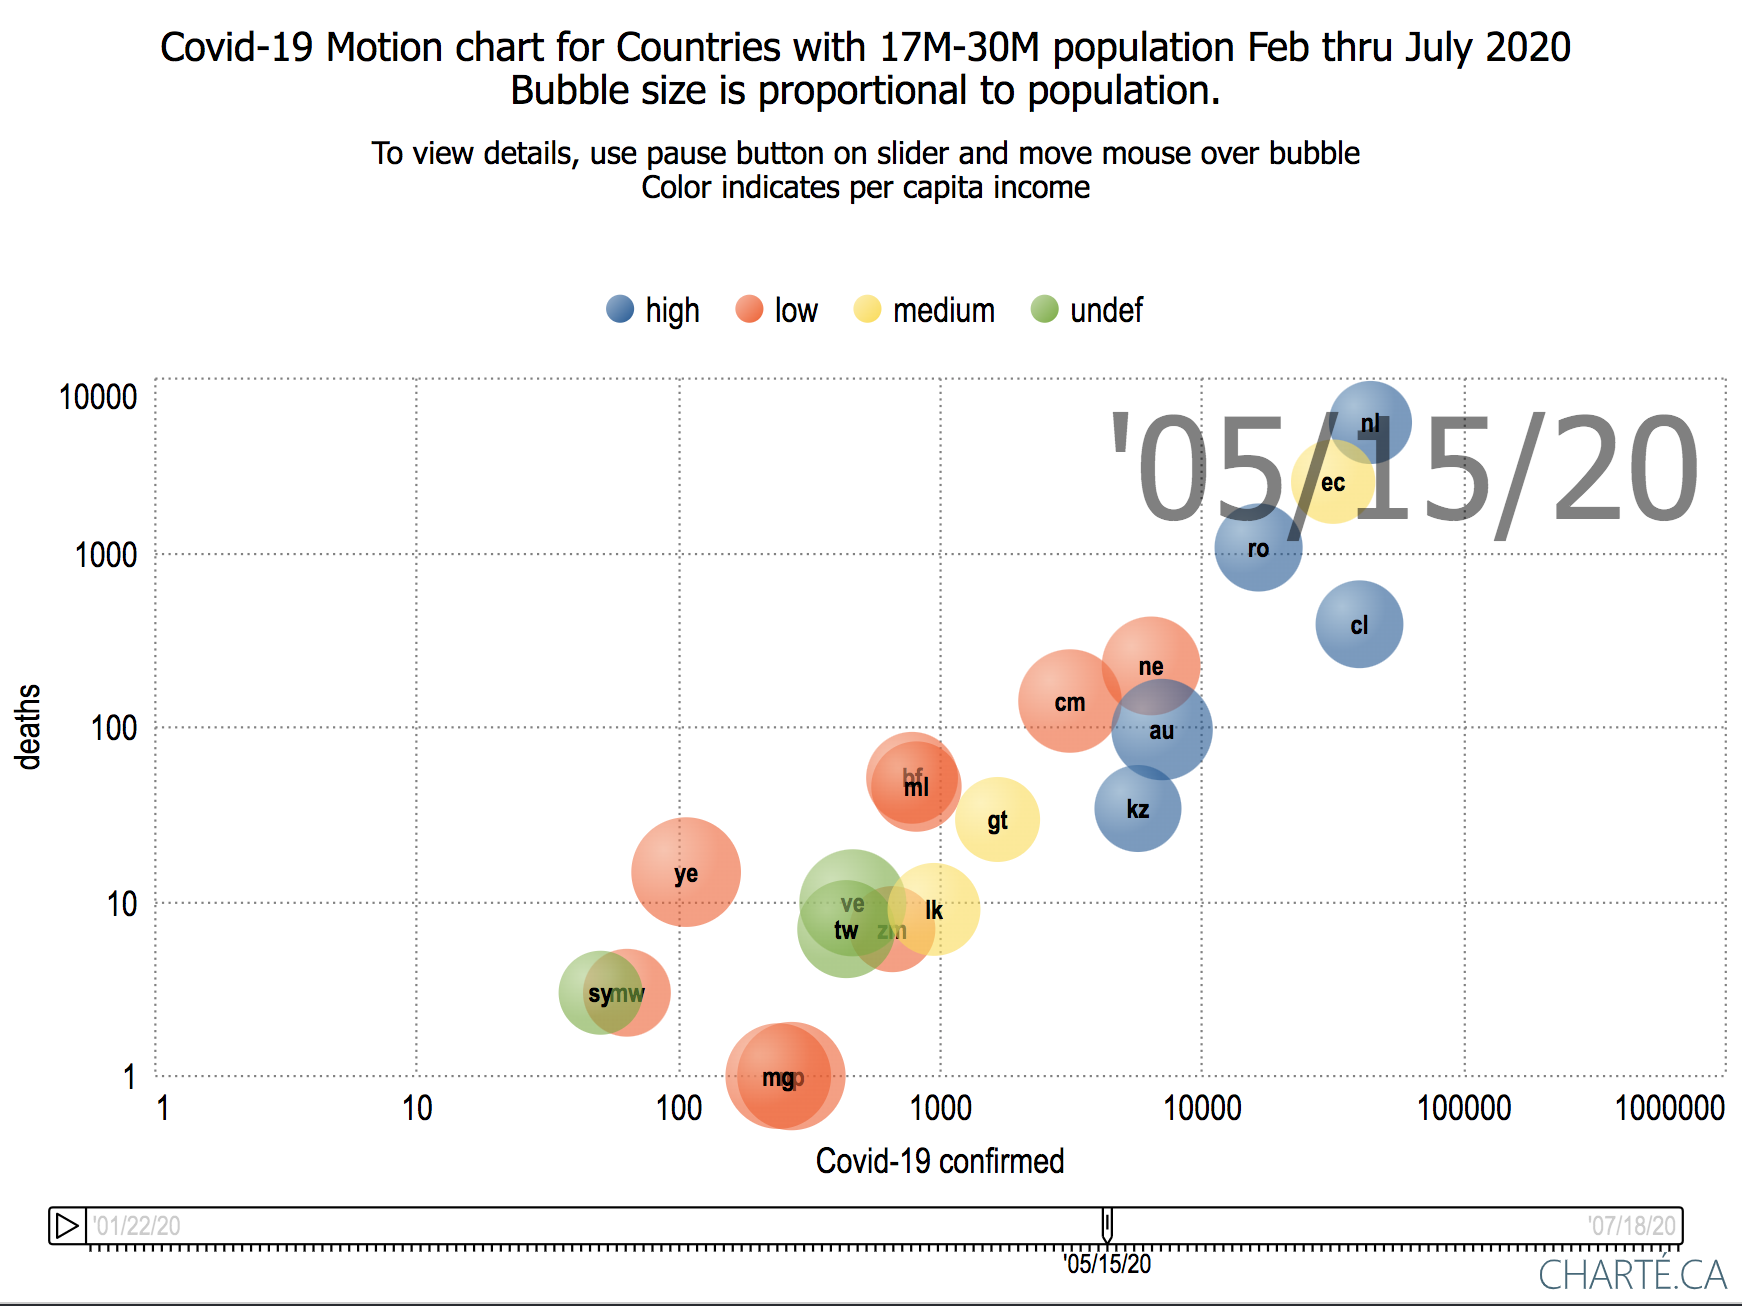
Click on each image to bring up the Motion Metric chart. The country for each bubble is identified by the Top Level Domain (TLD) of the Country. To take control of a chart, click on the two vertical bars at the left-hand end of the slider at the bottom of the chart, to change it tol a right arrow. Now you can manually move the slider back and forth with the mouse to change the date the data is being displayed for. Also, you can move the mouse over a bubble to learn more about the demographics of the country represented by the bubble.
Chart of deaths versus confirmed cases for countries with at least 50M population.
| January thru July deaths vs confirmed cases | January thru July deaths/population vs confirmed cases/population | January thru July Deaths/population density vs confirmed cases/population density |
|---|---|---|
For more details on the US see Covid-19 - Visualizing the data with Motion Charts.
Observations:
- China starts much earlier than any other country.
- The first country to record a death after China (cn) is Japan (jp) on Feb 11, followed by Iran (ir) on Feb 17.
- By the 4th week of February, South Korea (kr) and Japan (jp) countries close to Japan, together with Iran (ir) and Italy (it) had taken the lead in deaths.
- By the start of Apr: Italy (it), Spain (es), the UK (uk), France (fr) and Iran (ir) had overtaken China in number of deaths and Germany (de) and Turkey (tr) were catching up.
- By the start of May: the US, Italy, France and the UK are clear leaders in terms of deaths, and Turkey (tr), Russia (ru), India (in) and Peru (pe) were close behind China in terms of deaths.
- At that time, the US had over 6 times the confirmed cases of the second place UK, and well over two times the deaths.
- It is noticeable that from Mar thru Jun Japan (jp), South Korea (kr) and Malaysia appear to have slowed the growth and are passed by many other countries.
- By Jul 17th, Brazil (br) was closing in on the US with both of Brazil's confirmed cases and deaths within a factor of two of the US.
- On July 18, concerning the ratio of deaths to confirmed cases, the lowest value was for Vietnam (0 deaths in 382 confirmed cases), followed by Bangladesh (1.3%), South Africa (1.5%) and Russia (1.6%). The highest ratio was for the UK (15.3%).


