...
- cases with bubbles sized by US state population and colored by per capita income (Jan 28, 2020 - Apr 28, 2000)
- cases per million population with bubbles sized by US state population (May 1, 2020 - Jun 22, 2020)
- cases per million population with bubbles sized by US state population and colored by per capita income (May 1, 2020, Jun 25, 2020)
- cases with bubbles sized by population density of state and colored by per capita income (May 1 2020 - Jun 26, 2020)
- March 1, 2020 - July 20, 2020
Motion Charts with bubbles sized by US state population and colored by per capita income Mar 1, 2020 thru Jul 20
US State population > 10 Million population US State population 6-10 Million population US States 3-6 Million population US States 1.3-3M population 

 Looking at the data for July 27th we see the following
US by state + DC every 5 days color=income US by state + DC every 4 days color=%Hispanic+Black 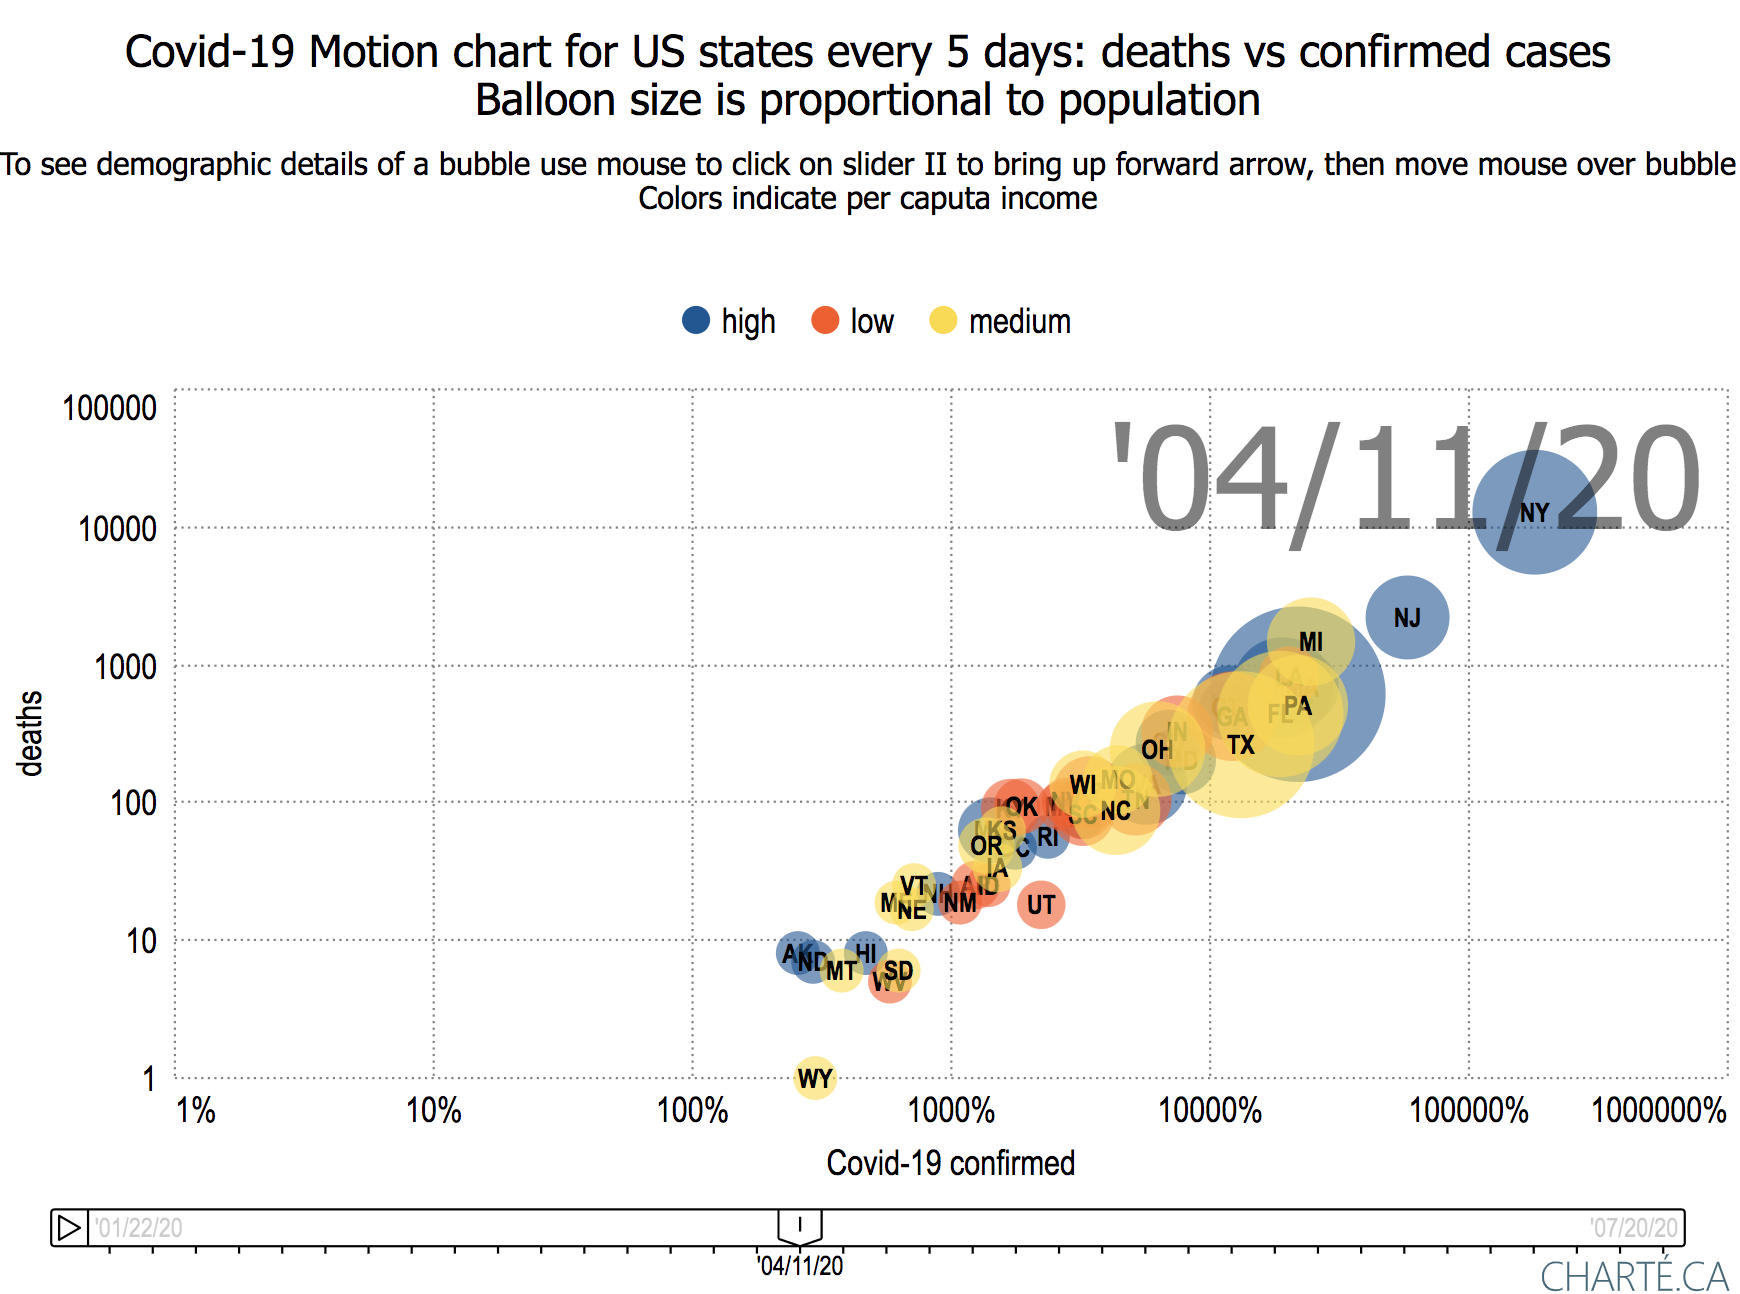


Daily:
- daily cases per million population with bubbles sized by US state population and colored by per capita income (May 1, 2020, Jun 26, 2020)
- cases with bubbles sized by US state population and colored by per capita income (May 1, 2020, Jun 26, 2020)
...