...
The Covid-19 statistics are from the Johns Hopkins University (JHU). There are raw data for confirmed cases and deaths by date for each county in each US state. For the US state analysis, the data from the counties are aggregated into the values for each state.
For each state or California county, we extracted various demographics including the ISO 2 character label, population, area, population density, education, income, median age, political leaning. The demographics were obtained from the following sources for the US.
...
- Looking at the total deaths vs cases it is seen that New York (NY), Delaware (DE), Massachusetts (MA), Rhode Island (RI) and Connecticut (CT) lead the pack followed by Maryland (MD), Illinois (IL) and more recently Louisiana (LA) but other states are catching up.
- It is a similar situation when one normalizes the states by their populations.
- When one looks at the new daily confirmed cases/Million state population and deaths/Million state population it is seen to be very variable day-to-day.
- Arizona's increased confirmed cases pulled it away from the pack starting May 14, 2020, and Florida pulled away starting May 24, 2020
- The values of new Confirmed cases/day/Million State population appears to decrease as one moves forward in time beyond May 23 but then to increase again (driven by Arizona) starting June 14, 2020. Maybe this is part of the "opening".
- Comparing the above with the same data but not normalized by state population
- At the start of May there is a noticeable correlation between deaths and confirmed, by the end of June the correlation is much weaker
- At the start of May the deaths and confirmed is dominated by New York (NY), New Jersey (NJ), Illinois (IL), Massachusetts (MA), California (CA) and Maryland (MD). By the end of June California (CA)is still a leader joined by Texas (TX), Florida (FL), Arizona (AZ), and Georgia (GA).
- Looking at the cases with bubbles sized by population density:
- Some states with high population densities such as New York (NY), New Jersey (NJ) and Massachusetts (MA) have high numbers of confirmed cases while others such as Washington DC, Rhode Island (RI), Delaware (DE) have fairly low numbers of confirmed cases.
- In general, the deaths/confirmed cases appear to be falling with time for especially as we get into June. This may be a mixture of increased testing finding more cases as well as more effective treatment.
- Exceptions that are still increasing include: NJ, MA, PA, CT, SD, NH, IL.
- Jul 22 California passes New York in number of confirmed cases (California population ~ 39M, New York population 20M), New York still has roughly four times California's deaths.
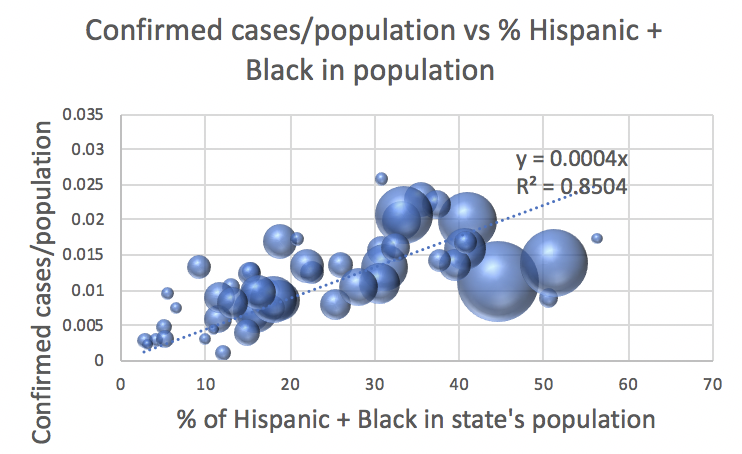
Looking at the July 24, 2020 JHU data there is a strong correlation between the total Confirmed case/state population and the % Hispanic + Black of the state's population.
Confirmed cases/population vs % Hispanic & Black (bubble sizes proportional to state's population) Confirmed cases/population vs % Black (bubble sizes proportional to state's population) Deaths/population vs % Hispanic + Black (bubble sizes proportional to state's population) - Confirmed Cases/population
The ten states with the leading confirmed cases/population as of 7/26/2020 were:
State ID confirmed/Pop deaths/Pop Pop-Density(pop/sq-km) Delaware DE 0.026143 0.00143 485.343 Arizona AZ 0.023728 0.000484 60.109 Louisiana LA 0.023032 0.000806 108.109 Florida FL 0.020909 0.000289 378.019 New York NY 0.020799 0.001648 420.061 New Jersey NJ 0.020023 0.001762 1218.114 Mississippi MS 0.01765 0.000502 63.771 District of Columbia DC 0.017524 0.000864 11020.131 Rhode Island RI 0.017253 0.000949 1021.565 Massachusetts MA 0.017019 0.001255 871.08 The lowest ten states were:
State ID confirmed/Pop deaths/Pop Pop-Density(pop/sq-km) Hawaii HI 0.001176 0.000018 222.887 Vermont VT 0.002236 0.000089 67.923 Maine ME 0.002869 0.00009 43.1 West Virginia WV 0.003193 0.000056 76.717 Montana MT 0.003234 0.000045 7.097 Alaska AK 0.003419 0.000027 1.294 Oregon OR 0.004162 0.000072 41.974 Wyoming WY 0.004532 0.000063 6.037 New Hampshire NH 0.004837 0.000307 148.621 Kentucky KY 0.00612 0.000158 112.067 - The number of days from the first confirmed case to the first death was 57 +- 6 days.
California
| Include Page | ||||
|---|---|---|---|---|
|
...


