...
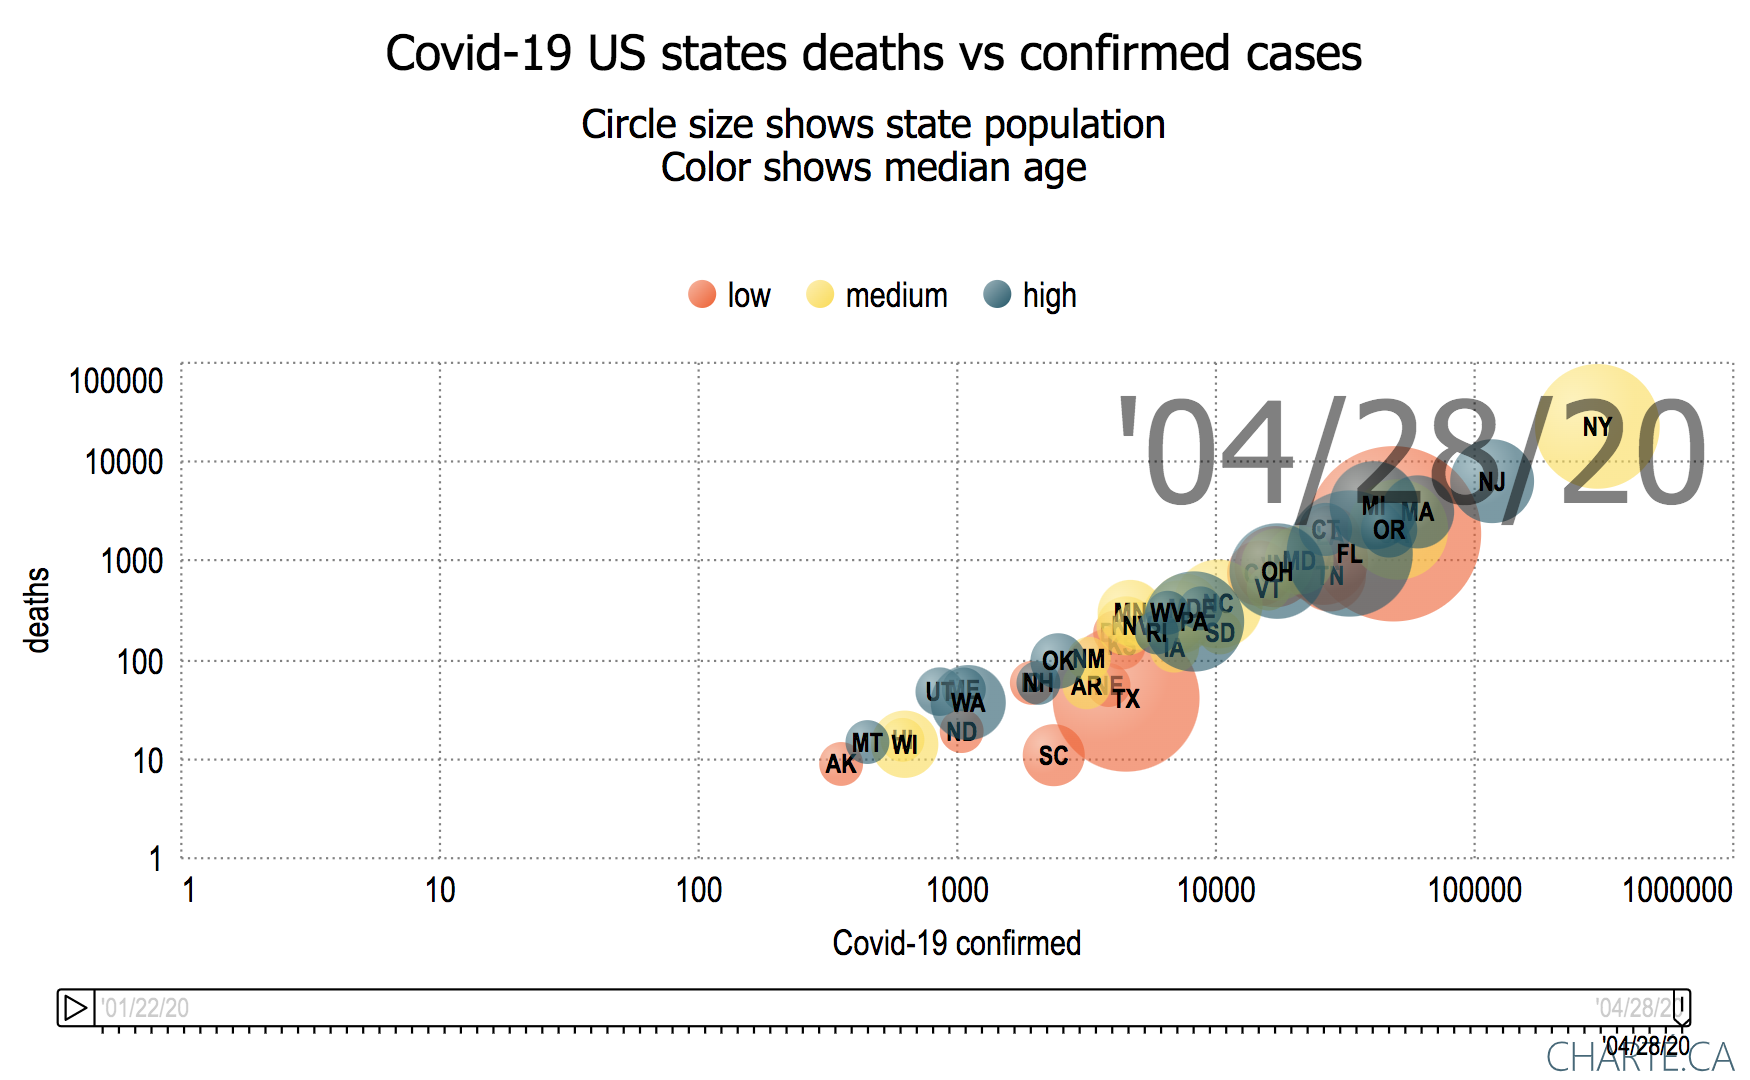
- Looking at the total deaths vs cases it is seen that New York (NY), Delaware (DE), Massachusetts (MA), Rhode Island (RI) and Connecticut (CT) lead the pack followed by Maryland (MD), Illinois (IL) and more recently Louisiana (LA) but other states are catching up.
- It is a similar situation when one normalizes the states by their populations.
- When one looks at the new daily confirmed cases/Million state population and deaths/Million state population it is seen to be very variable day-to-day.
- Arizona's increased confirmed cases pulled it away from the pack starting May 14, 2020, and Florida pulled away starting May 24, 2020
- The values of new Confirmed cases/day/Million State population appears to decrease as one moves forward in time beyond May 23 but then to increase again (driven by Arizona) starting June 14, 2020. Maybe tgis part of the "opening".
- Comparing the above with the same data but not normalized by state population
- At the start of May there is a noticeable correlation between deaths and confirmed, by the end of June the correlation is much weaker
- At the start of May the deaths and confirmed is dominated by New York (NY), New Jersey (NJ), Illinois (IL), Massachusetts (MA), California (CA) and Maryland (MD). By the end of June California (CA)is still a leader joined by Texas (TX), Florida (FL), Arizona (AZ), and Georgia (GA).
- Looking at the cases with bubbles sized by population density:
- Some states with high population densities such as New York (NY), New Jersey (NJ) and Massachusetts (MA) have high numbers of confirmed cases while others such as Washington DC, Rhode Island (RI), Delaware (DE) have fairly low numbers of confirmed cases.
- In general, the deaths/confirmed cases appear to be falling with time for especially as we get into June. This may be a mixture of increased testing finding more cases as well as more effective treatment.
- Exceptions that are still increasing include: NJ, MA, PA, CT, SD, NH, IL.
- Jul 22 California passes New York in number of confirmed cases (California population ~ 39M, New York population 20M), New York still has roughly four times California's deaths.
California
| Include Page | ||||
|---|---|---|---|---|
|
Visualizing countries with larger populations|
| Include Page | ||||
|---|---|---|---|---|
|
Visualizing Africa, Asia, Europe and South America
| Include Page | ||||
|---|---|---|---|---|
|
Notes
Demographic correlations for California
...
It is seen that there is a strong correlation between the per capita income and education and between confirmed cases and population, a medium correlation between registered voter political leaning and education. The excel spreadsheet of the analysis of the above demographics and their correlations can be found here.
Use of www.charte.ca
We noticed that with a large amount of data (e.g. over 2200 lines of Excel comma-separated value data from say each day from January 22 thru July 22 and say greater than 20 states) the building of a grouped motion chart would not complete. Thus we broke the data down by either reducing the number of states (e.g. by selection states based on their population range)or reducing the number of days (e.g. by only including every 5th day).
Ungrouped
Deaths vs Confirmed:
...
Grouped by Income | Grouped by Age | Grouped by Education (Bachelor degree or Equivalent) |
|---|---|---|
 |  |  |
Visualizing countries with larger populations|
...