...
- Looking at the total deaths vs cases it is seen that New York (NY), Delaware (DE), Massachusetts (MA), Rhode Island (RI) and Connecticut (CT) lead the pack followed by Maryland (MD), Illinois (IL) and more recently Louisiana (LA) but other states are catching up.
- It is a similar situation when one normalizes the states by their populations.
- When one looks at the new daily confirmed cases/Million state population and deaths/Million state population it is seen to be very variable day-to-day.
- Arizona's increased confirmed cases pulled it away from the pack starting May 14, 2020, and Florida pulled away starting May 24, 2020
- The values of new Confirmed cases/day/Million State population appears to decrease as one moves forward in time beyond May 23 but then to increase again (driven by Arizona) starting June 14, 2020. Maybe tgis part of the "opening".
- Comparing the above with the same data but not normalized by state population
- At the start of May there is a noticeable correlation between deaths and confirmed, by the end of June the correlation is much weaker
- At the start of May the deaths and confirmed is dominated by New York (NY), New Jersey (NJ), Illinois (IL), Massachusetts (MA), California (CA) and Maryland (MD). By the end of June California (CA)is still a leader joined by Texas (TX), Florida (FL), Arizona (AZ), and Georgia (GA).
- Looking at the cases with bubbles sized by population density:
- Some states with high population densities such as New York (NY), New Jersey (NJ) and Massachusetts (MA) have high numbers of confirmed cases while others such as Washington DC, Rhode Island (RI), Delaware (DE) have fairly low numbers of confirmed cases.
- In general, the deaths/confirmed cases appear to be falling with time for especially as we get into June. This may be a mixture of increased testing finding more cases as well as more effective treatment.
- Exceptions that are still increasing include: NJ, MA, PA, CT, SD, NH, IL.
- Jul 22 California passes New York in number of confirmed cases (California population ~ 39M, New York population 20M), New York still has roughly four times California's deaths.
California
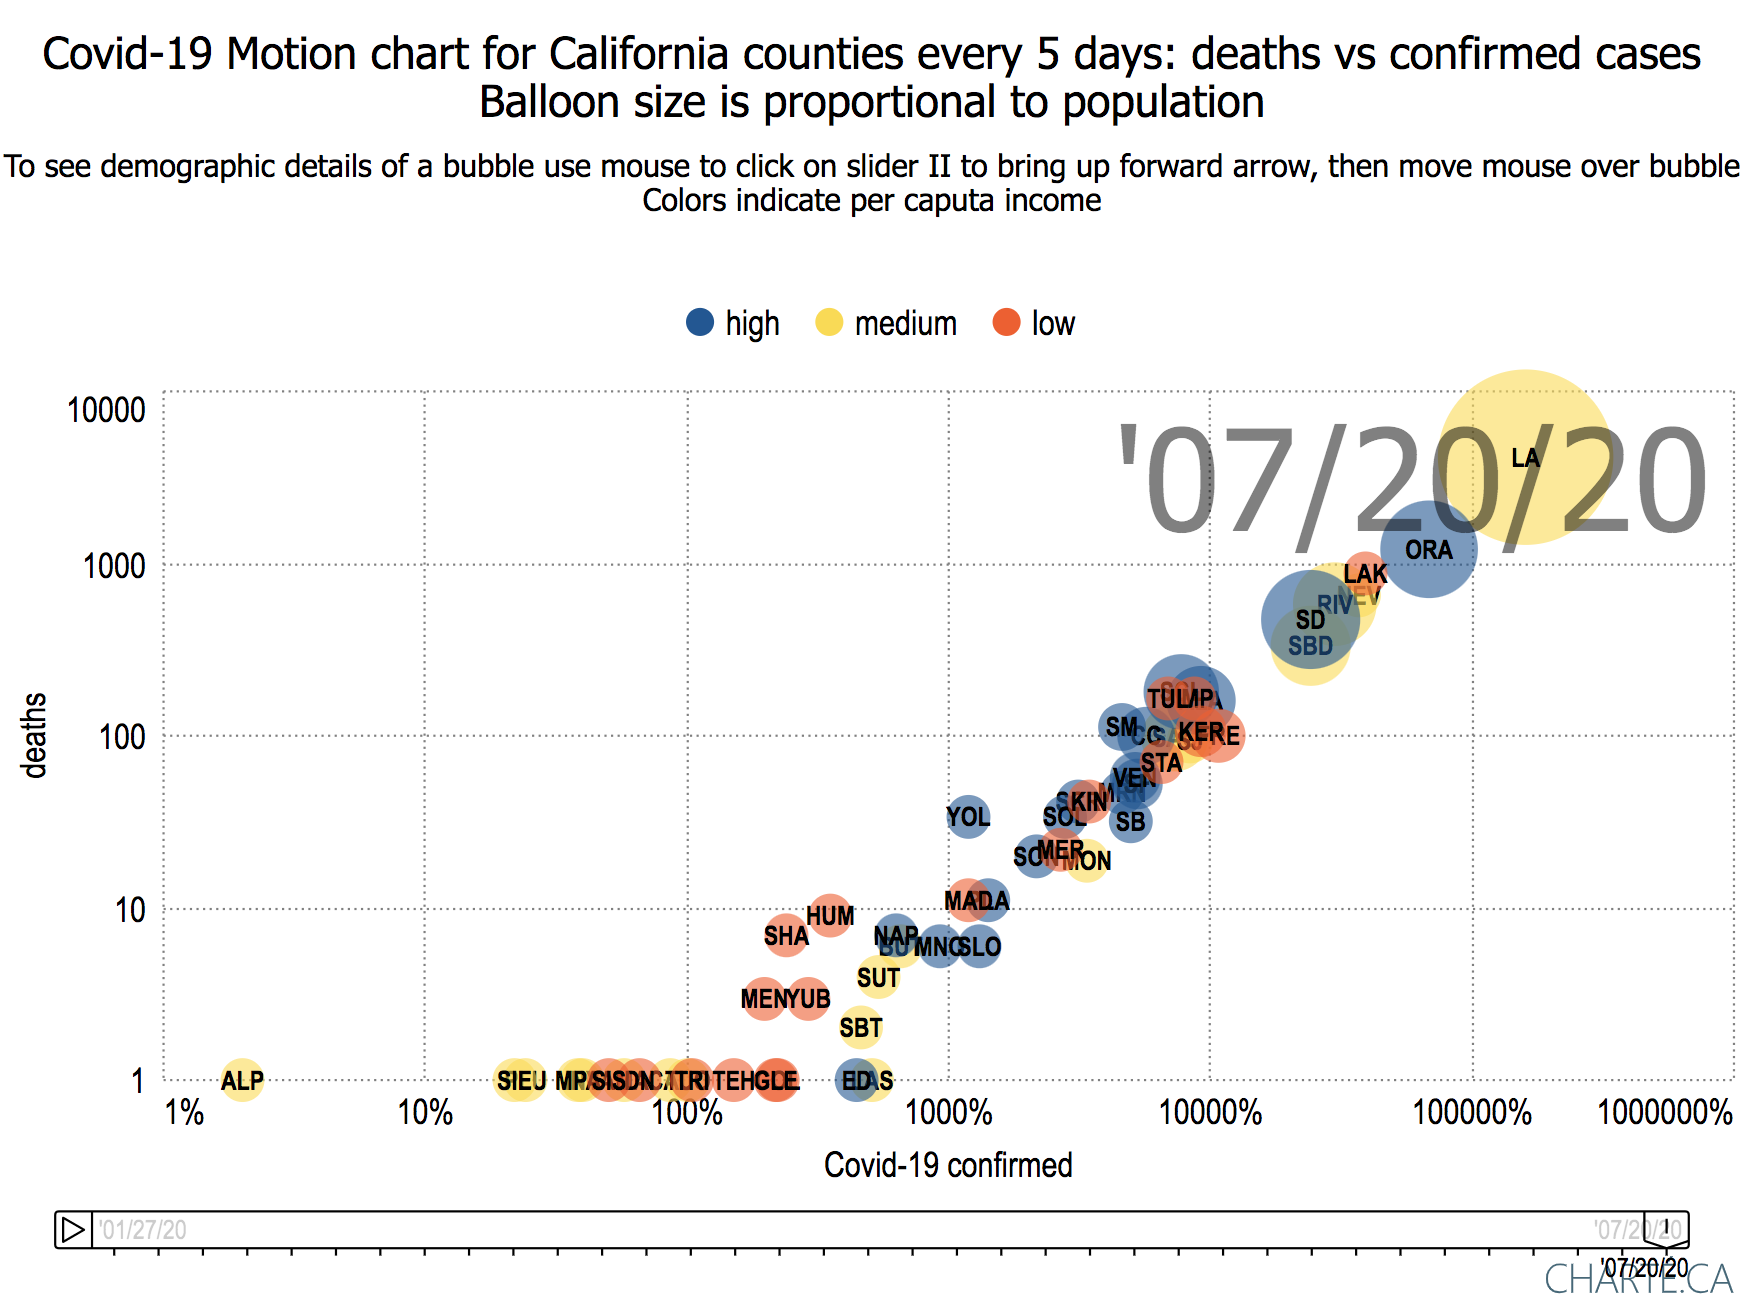
California Counties Motion Charts of Covid-19 deaths vs confirmed cases
bubbles sized by population density for CA Counties and colored by per capita income (Jan 25, 2020 - Apr 30, 2020)
cases per million population with bubbles sized by CA county population and colored by per capita income (May 1, 2020 - Jun 25, 2020)
| California by County every 5 days |
|---|
 |
Observations:
- Deaths are roughly linear with confirmed cases on a log scale
- By March 24th the following counties were already observing deaths: Santa Clara (SCL), Riverside (RIV), San Jose (SJ), Sacramento (SAC), LA County, Orange County.
- By June 25th:
- In terms of confirmed cases and deaths per 1 Million county population
- The leading counties are Lake (LAK), Nevada (NEV), Mono (MNO) with Imperial (IMP) catching up since the end of May.
- These are followed by LA County (LA), Orange Country (OR), Kings County (KIN), Tuolumne (TUO) and Riverside (RIV).
- If one just takes the number of cases (i.e. do not normalize by the population of the county) then:
- The leading counties are LA County (LA), Orange County (OR), Lake County (LAK), Nevada County (Nevada), Riverside (RIV), San Diego County (SD) and San Bernadino County (SBD)
- In general, the counties with lower per capita income appear to have lower numbers of confirmed cases and deaths, The exceptions are Lake County (LAK), Imperial County (IMP), Kern County (KER), Tuolumne County (TUO) and Fremont County (FRE).
- In terms of confirmed cases and deaths per 1 Million county population
- By July 20:
- LA county, Orange county (ORA), Lake, Riverside (RIV), San Diego (SD) and San Bernadino (SBD) counties by July 20 had a clear lead in deaths and confirmed cases.
- By this time LA county had almost four times the deaths of the next highest (Orange) county and almost three times the confirmed cases.
- The following counties had zero deaths:
| County | ID | Covid-19 confirmed | deaths | Population() |
| Alpine | ALP | 2 | 0 | 1202 |
| Amador | AMA | 57 | 0 | 37159 |
| Calaveras | CAL | 87 | 0 | 44921 |
| Colusa | COL | 223 | 0 | 21424 |
| El Dorado | ED | 443 | 0 | 181465 |
| Lassen | LAS | 512 | 0 | 33356 |
| Plumas | PLU | 24 | 0 | 19286 |
| Sierra | SIE | 22 | 0 | 3019 |
| Siskiyou | SIS | 50 | 0 | 44261 |
| Trinity | TRI | 104 | 0 | 13515 |
| Tuolumne | TUO | 101 | 0 | 54347 |
...
| Include Page | ||||
|---|---|---|---|---|
|
Notes
Demographic correlations for California
...