| Name
|
Size
|
Creator |
Creation Date
|
Last Modification Date
|
Labels |
Attached To |
|
JPEG File minrtt-isb.jpg |
214 kB |
Les Cottrell |
Jan 25, 2011 21:22 |
Jan 25, 2011 21:22 |
|
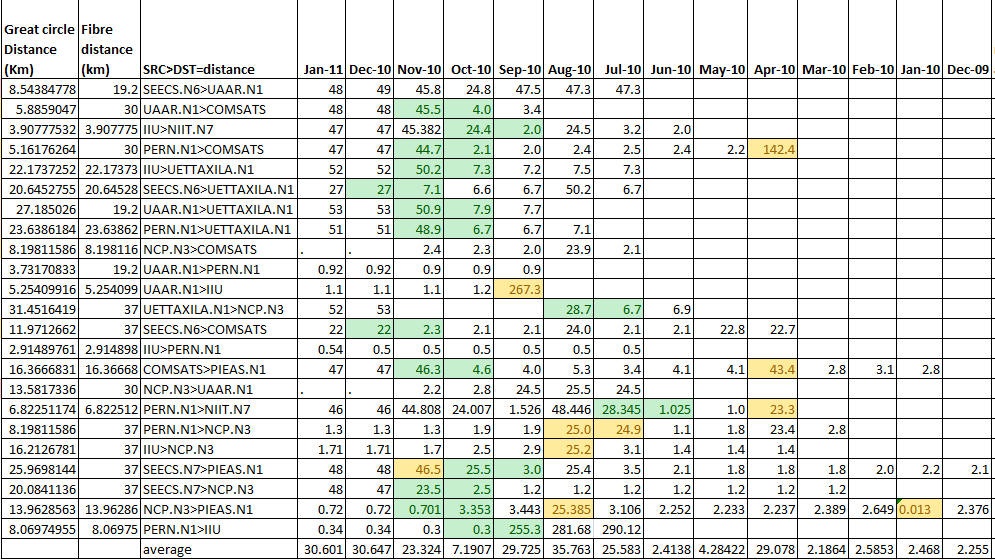
Page: Pakistani Case Study 2010-2011
|
|
PNG File Screen Shot 2022-05-10 at 11.43.17 AM.png |
214 kB |
Les Cottrell |
May 10, 2022 03:43 |
May 10, 2022 03:43 |
|
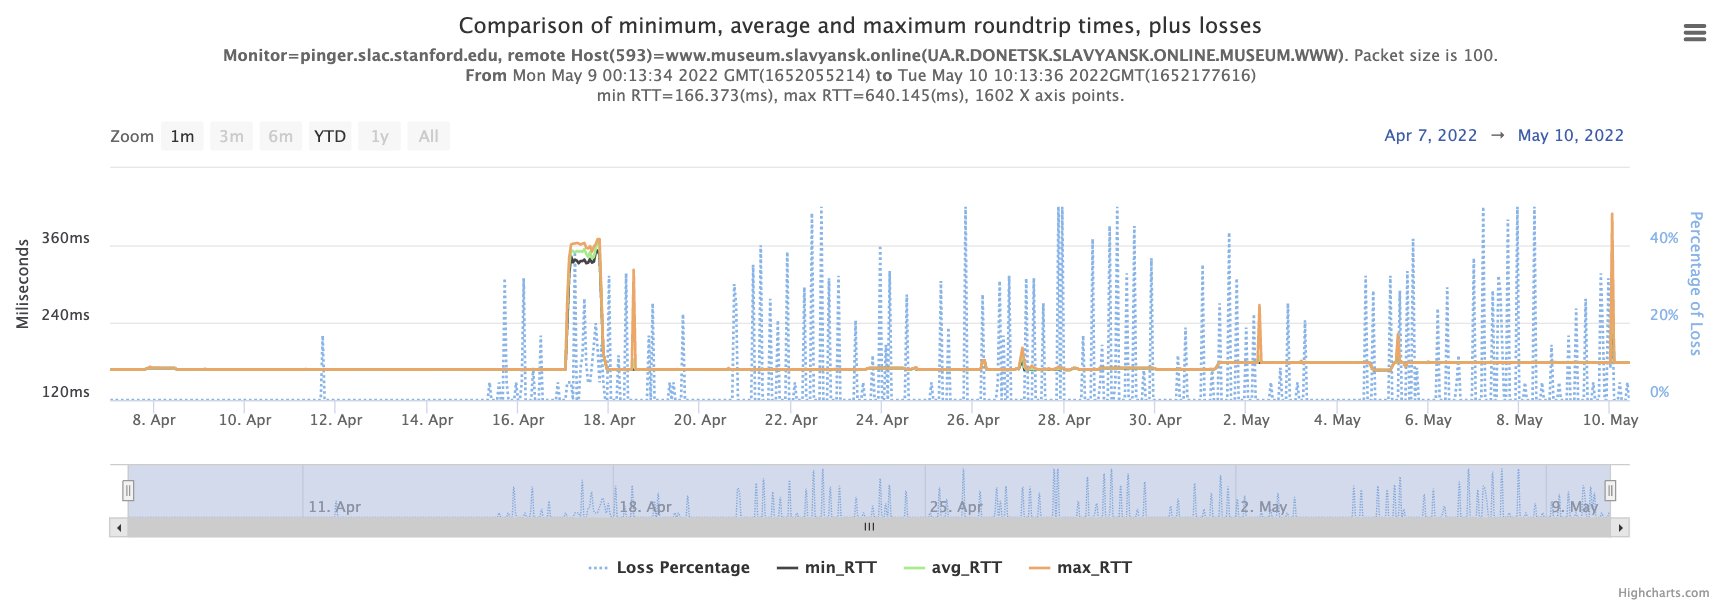
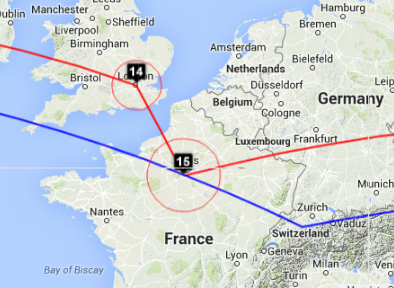
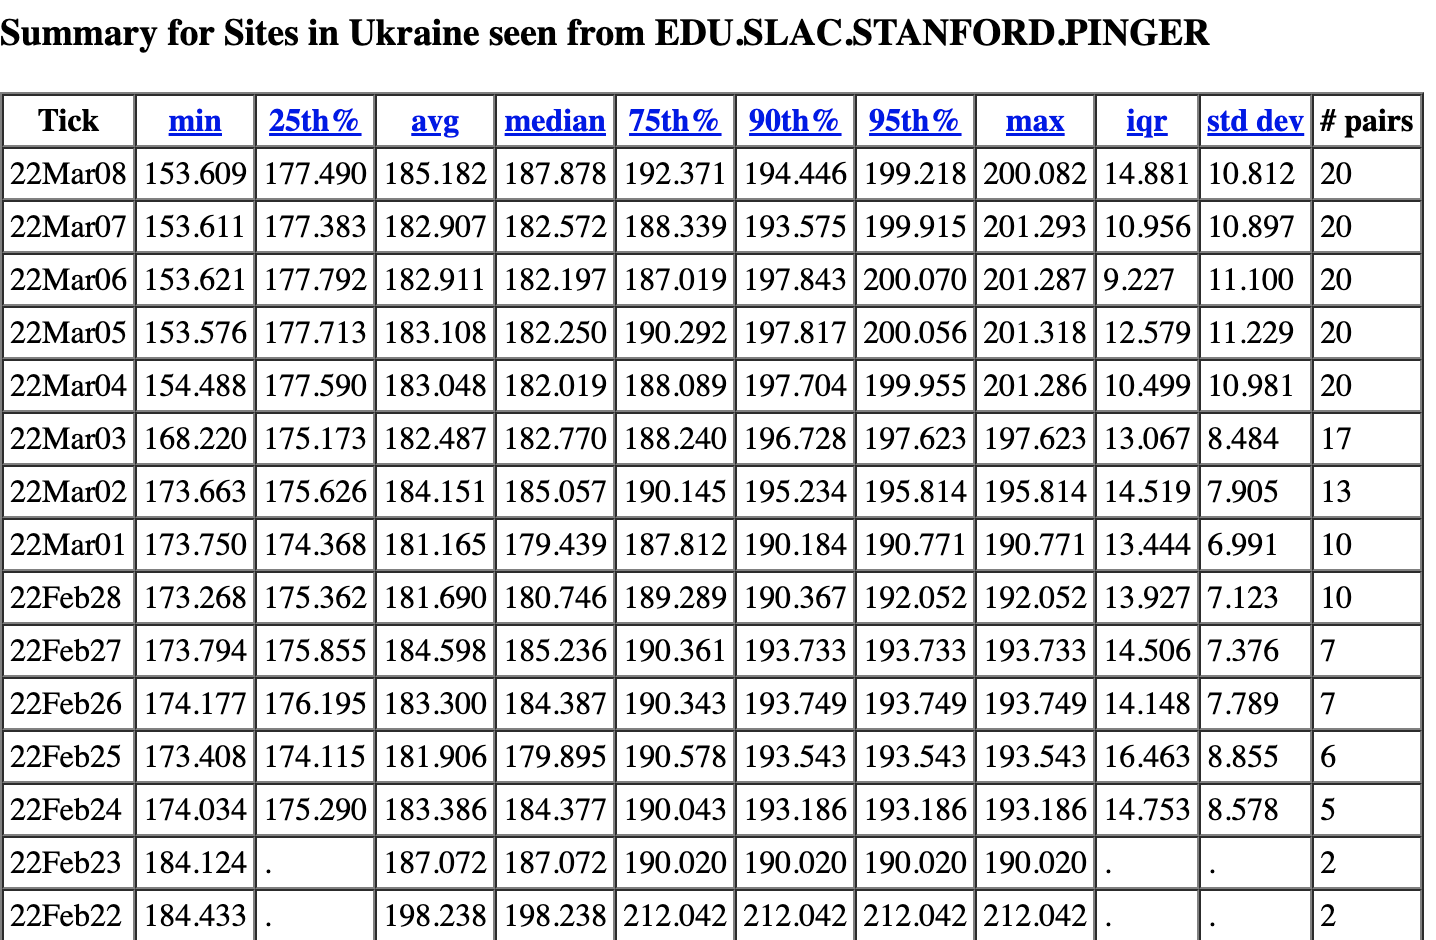
Page: Impact of the Russo Ukraine war on ping response times
|
|
Microsoft Powerpoint Presentation caida-rtt-vs-distance.pptx |
214 kB |
Les Cottrell |
Feb 20, 2010 19:52 |
Feb 20, 2010 19:52 |
|
Page: TULIP CAIDA RTT vs Distance Results
|
|
PNG File image2014-12-20 16:43:37.png |
214 kB |
Les Cottrell |
Dec 20, 2014 16:43 |
Dec 20, 2014 16:43 |
|
Page: TULIP Examples of Use
|
|
PNG File Screen Shot 2020-07-05 at 3.37.57 PM.png |
214 kB |
Les Cottrell |
Jul 05, 2020 15:38 |
Jul 05, 2020 15:38 |
|
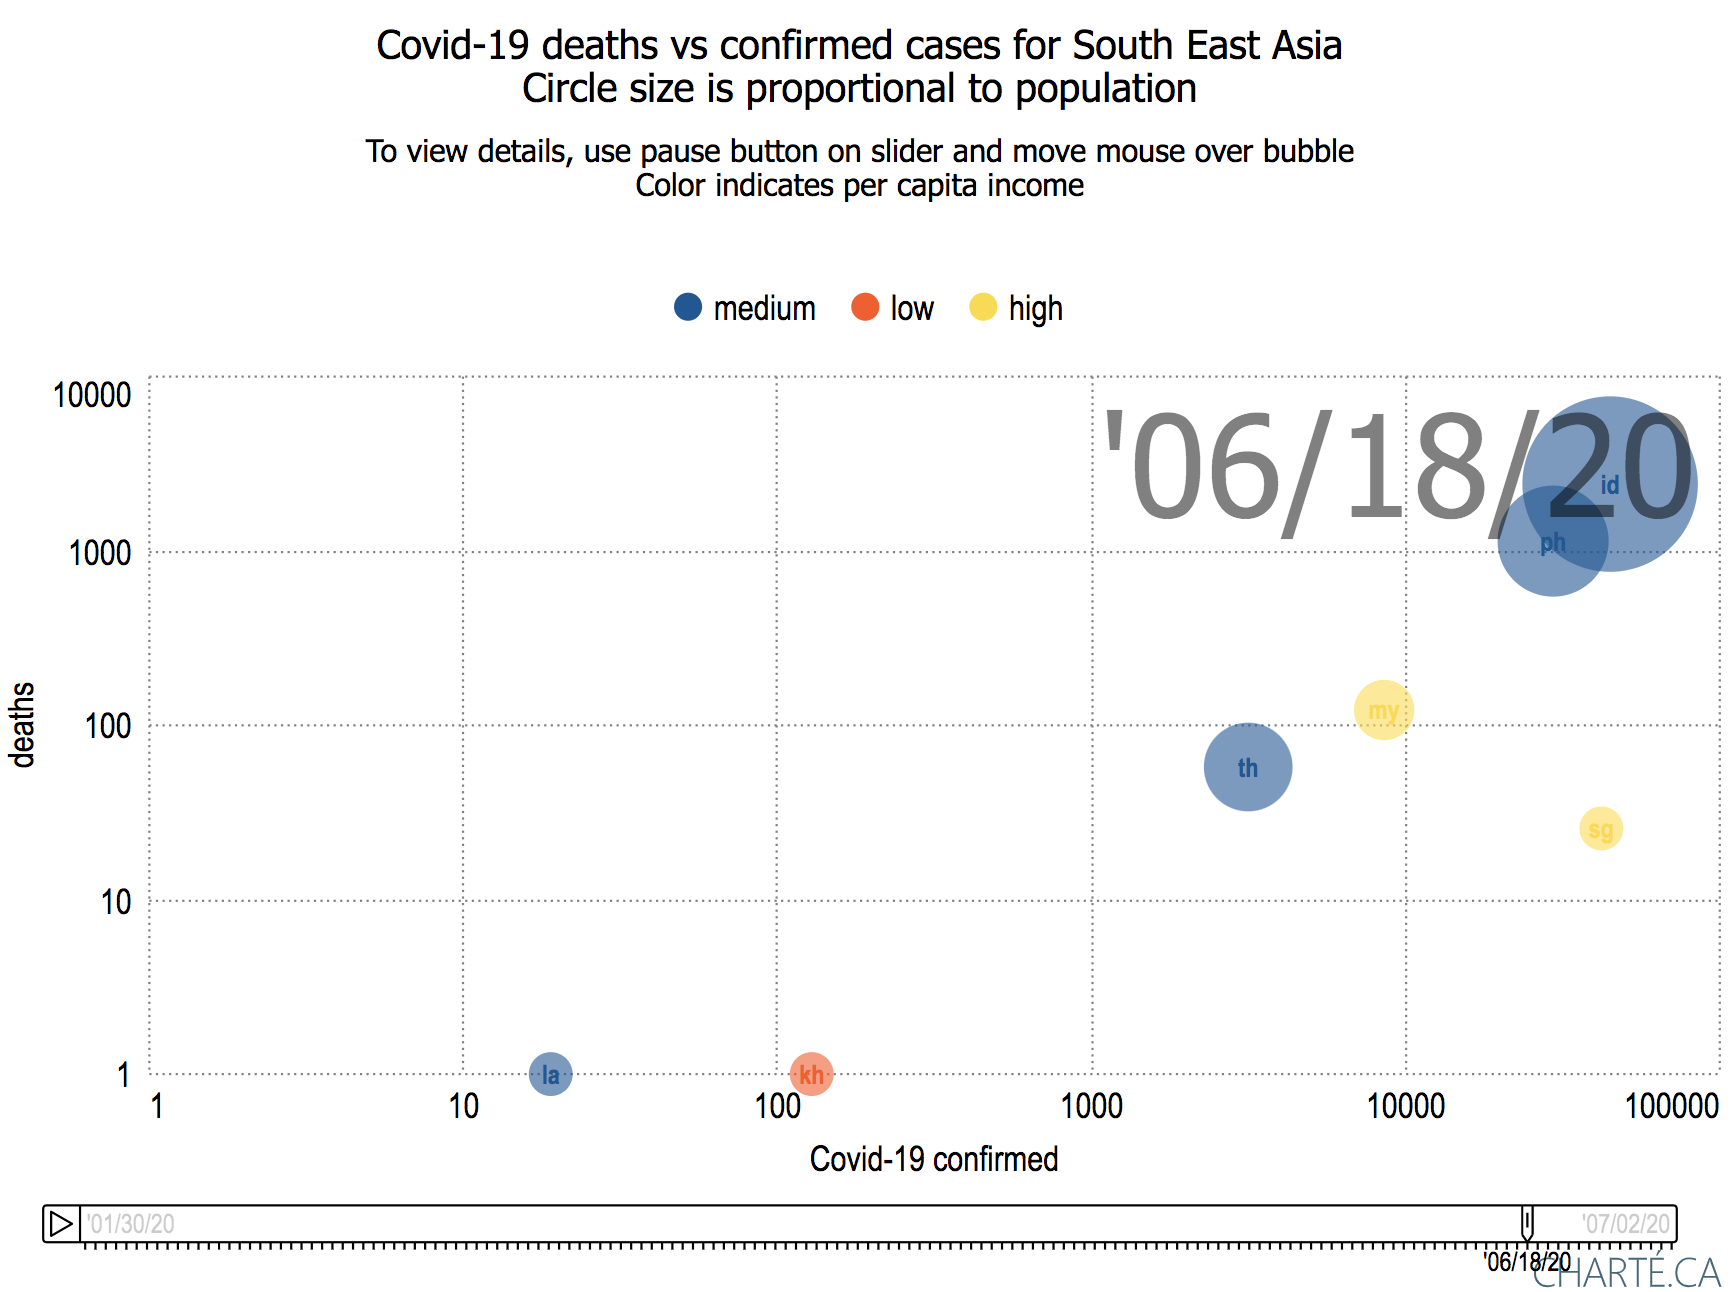
Page: Covid-19 - Visualizing the Africa, Asia, Europe and S America data
|
|
Microsoft Powerpoint Presentation seecs-taxila-stripcharts.pptx |
213 kB |
Les Cottrell |
Jan 21, 2011 09:54 |
Jan 21, 2011 09:54 |
|
Page: Pakistan
|
|
PNG File image2014-11-1 15:22:11.png |
213 kB |
Les Cottrell |
Nov 01, 2014 15:22 |
Nov 01, 2014 15:23 |
|
Page: Traceroute from SLAC to Daffodil International University site in Bangladesh
|
|
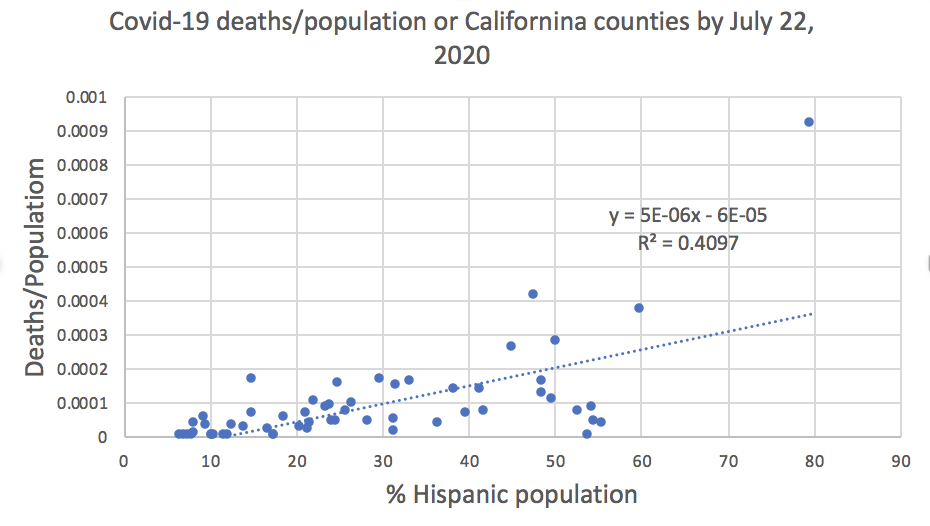
PNG File Screen Shot 2020-07-25 at 9.16.46 AM.png |
213 kB |
Les Cottrell |
Jul 25, 2020 09:18 |
Jul 25, 2020 09:18 |
|
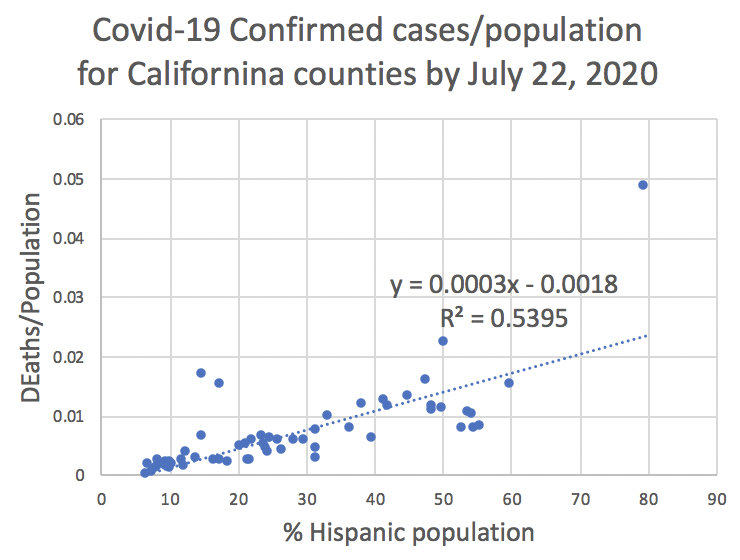
Page: Covid-19 - Visualizing California data
|
|
PNG File Screen Shot 2022-03-10 at 12.32.43 PM.png |
213 kB |
Les Cottrell |
Mar 10, 2022 12:34 |
Mar 10, 2022 12:34 |
|
Page: Impact of the Russo Ukraine war on ping response times
|
|
PNG File image2016-1-30 9:18:8.png |
213 kB |
Les Cottrell |
Jan 30, 2016 09:18 |
Jan 30, 2016 09:18 |
|
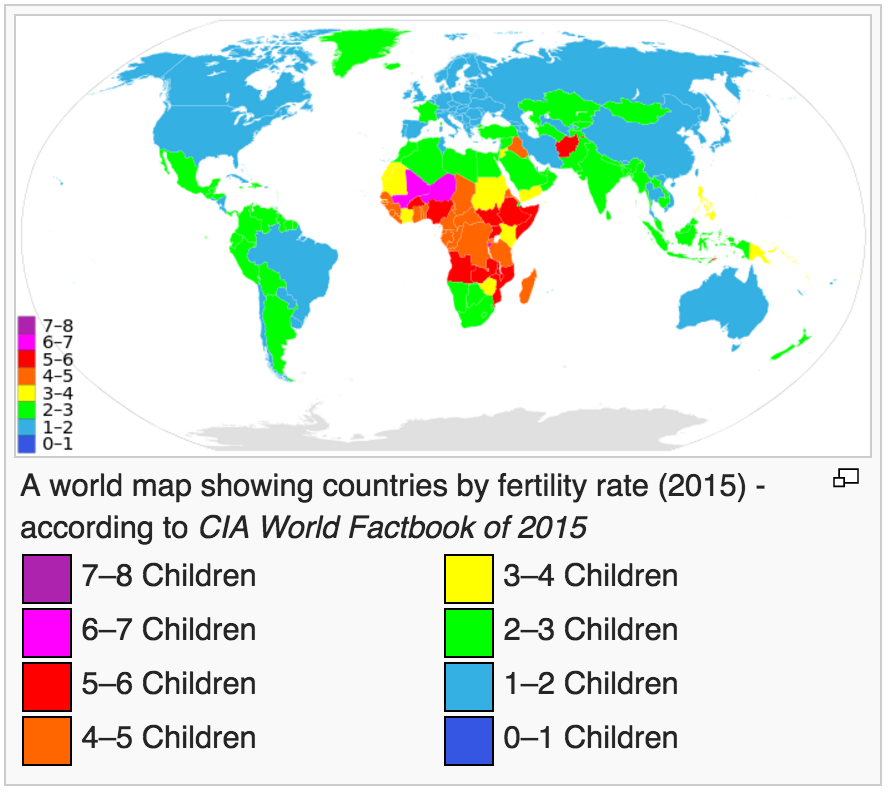
Page: Correlation of PingER throughput and Fertility
|
|
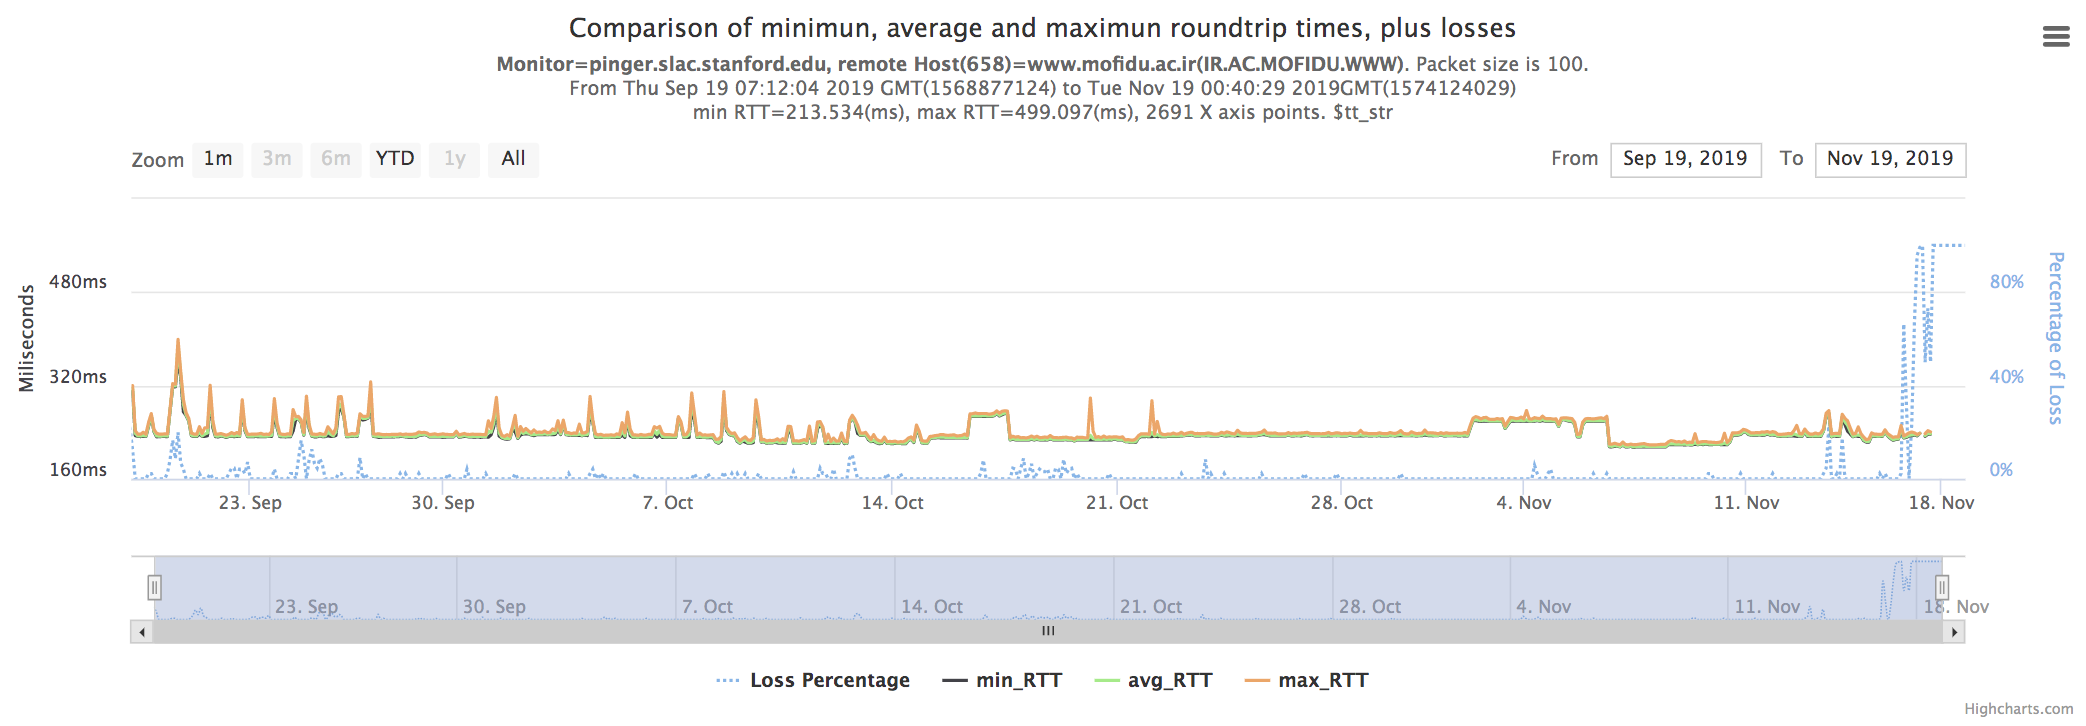
PNG File Screen Shot 2019-11-18 at 5.05.46 PM.png |
212 kB |
Les Cottrell |
Nov 18, 2019 17:06 |
Nov 18, 2019 17:06 |
|
Page: PingER Iran Internet interrupted November 2019
|
|
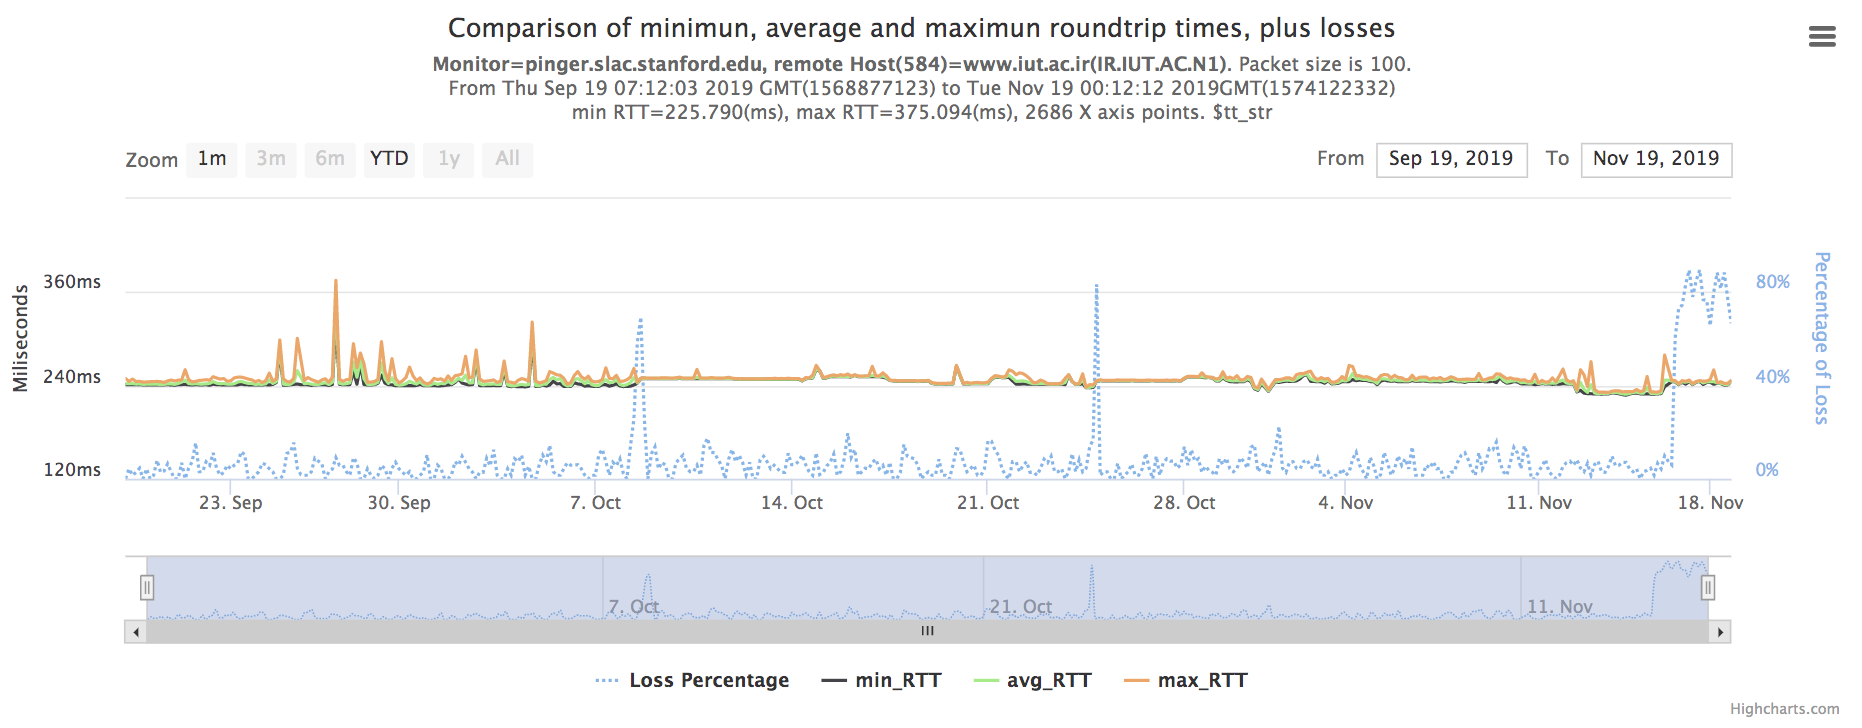
PNG File Screen Shot 2019-11-18 at 4.38.15 PM.png |
212 kB |
Les Cottrell |
Nov 18, 2019 16:41 |
Nov 18, 2019 16:41 |
|
Page: PingER Iran Internet interrupted November 2019
|
|
PNG File Screen Shot 2020-07-24 at 8.43.48 PM.png |
212 kB |
Les Cottrell |
Jul 24, 2020 20:44 |
Jul 24, 2020 20:44 |
|
Page: Covid-19 - Visualizing California data
|
|
PNG File Screen Shot 2022-03-09 at 1.20.39 PM.png |
212 kB |
Les Cottrell |
Mar 09, 2022 13:21 |
Mar 09, 2022 13:21 |
|
Page: Impact of the Russo Ukraine war on ping response times
|
|
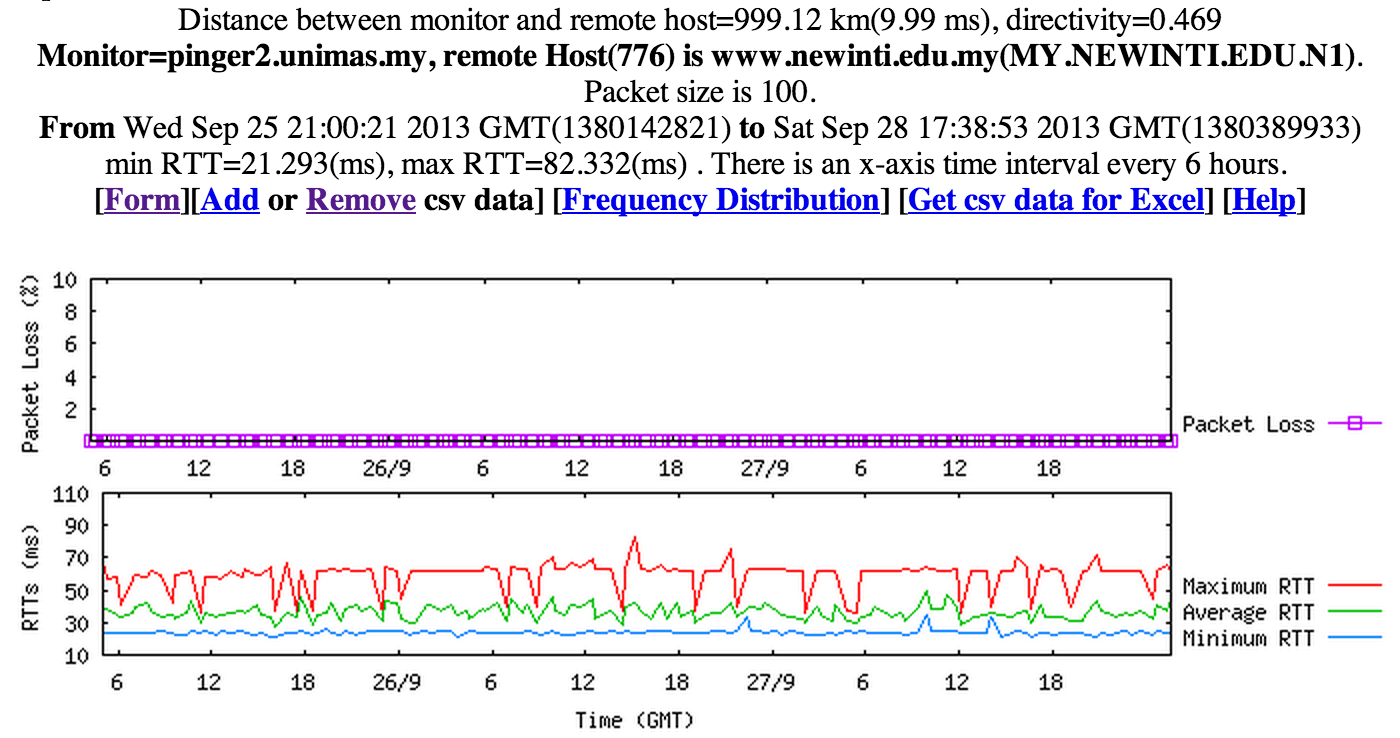
PNG File Screen Shot 2013-09-28 at 12.47.44 PM.png |
212 kB |
Les Cottrell |
Sep 28, 2013 12:53 |
Sep 28, 2013 12:53 |
|
Page: Comparison of PinGER RTTs from UNIMAS monitors N4 and RASPBERRY
|
|
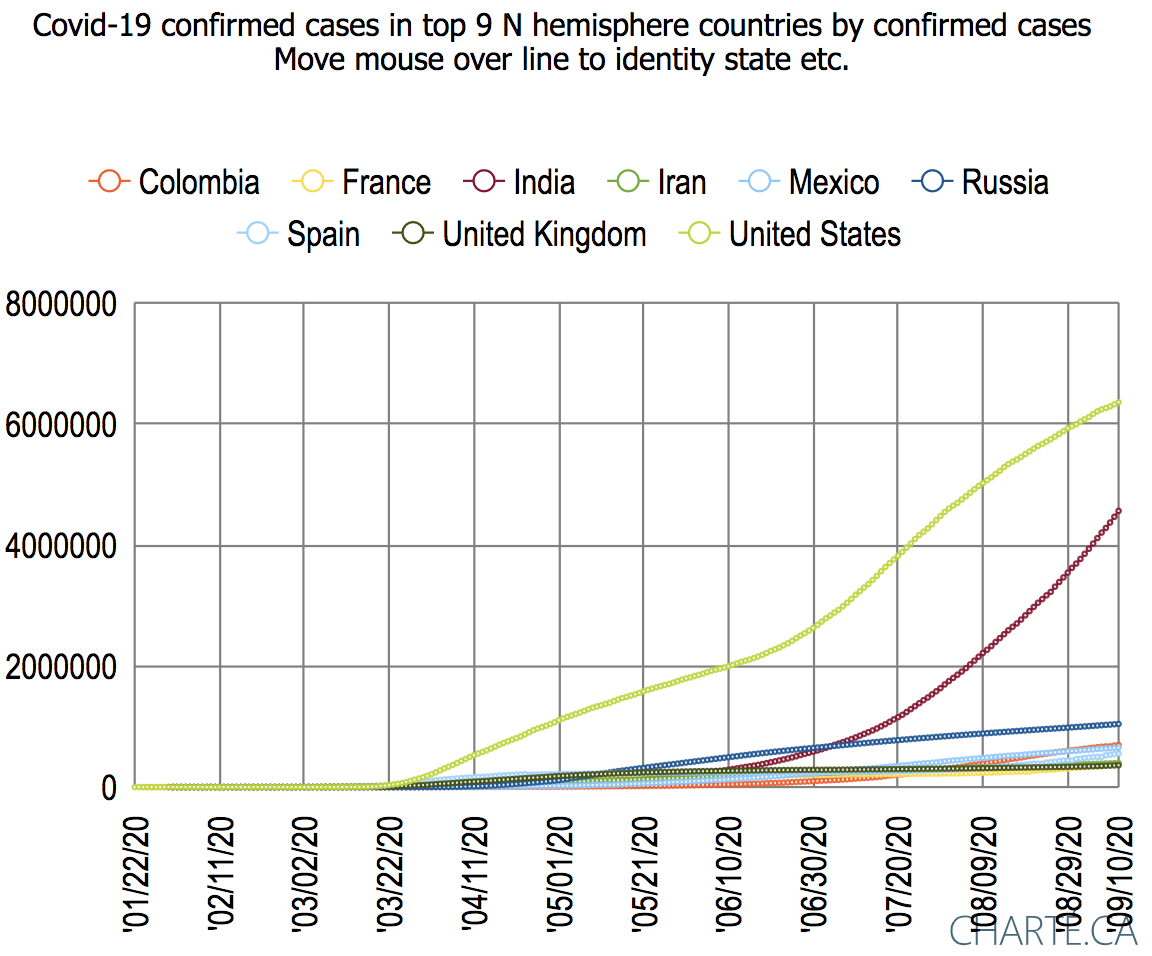
PNG File Screen Shot 2020-09-11 at 12.06.47 PM.png |
211 kB |
Les Cottrell |
Sep 11, 2020 12:07 |
Sep 11, 2020 12:21 |
|
Page: Covid-19 Top 9 N Hemisphere countries by confirmed cases 9/10/2020
|
|
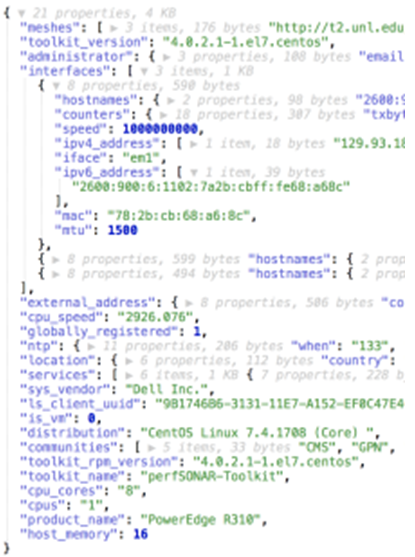
PNG File Snap1.png |
211 kB |
Les Cottrell |
Jan 12, 2018 21:38 |
Jan 12, 2018 21:45 |
|
Page: Get IPv6 addresses for perfSONAR
|
|
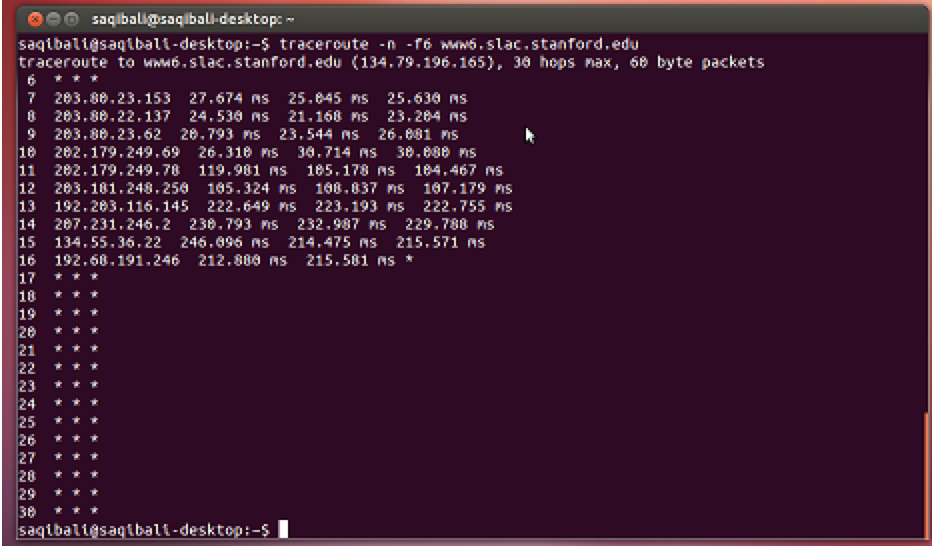
PNG File Screen Shot 2014-04-26 at 4.05.03 PM.png |
211 kB |
Les Cottrell |
Apr 26, 2014 16:05 |
Apr 26, 2014 16:05 |
|
Page: Traceroute at UMT
|
|
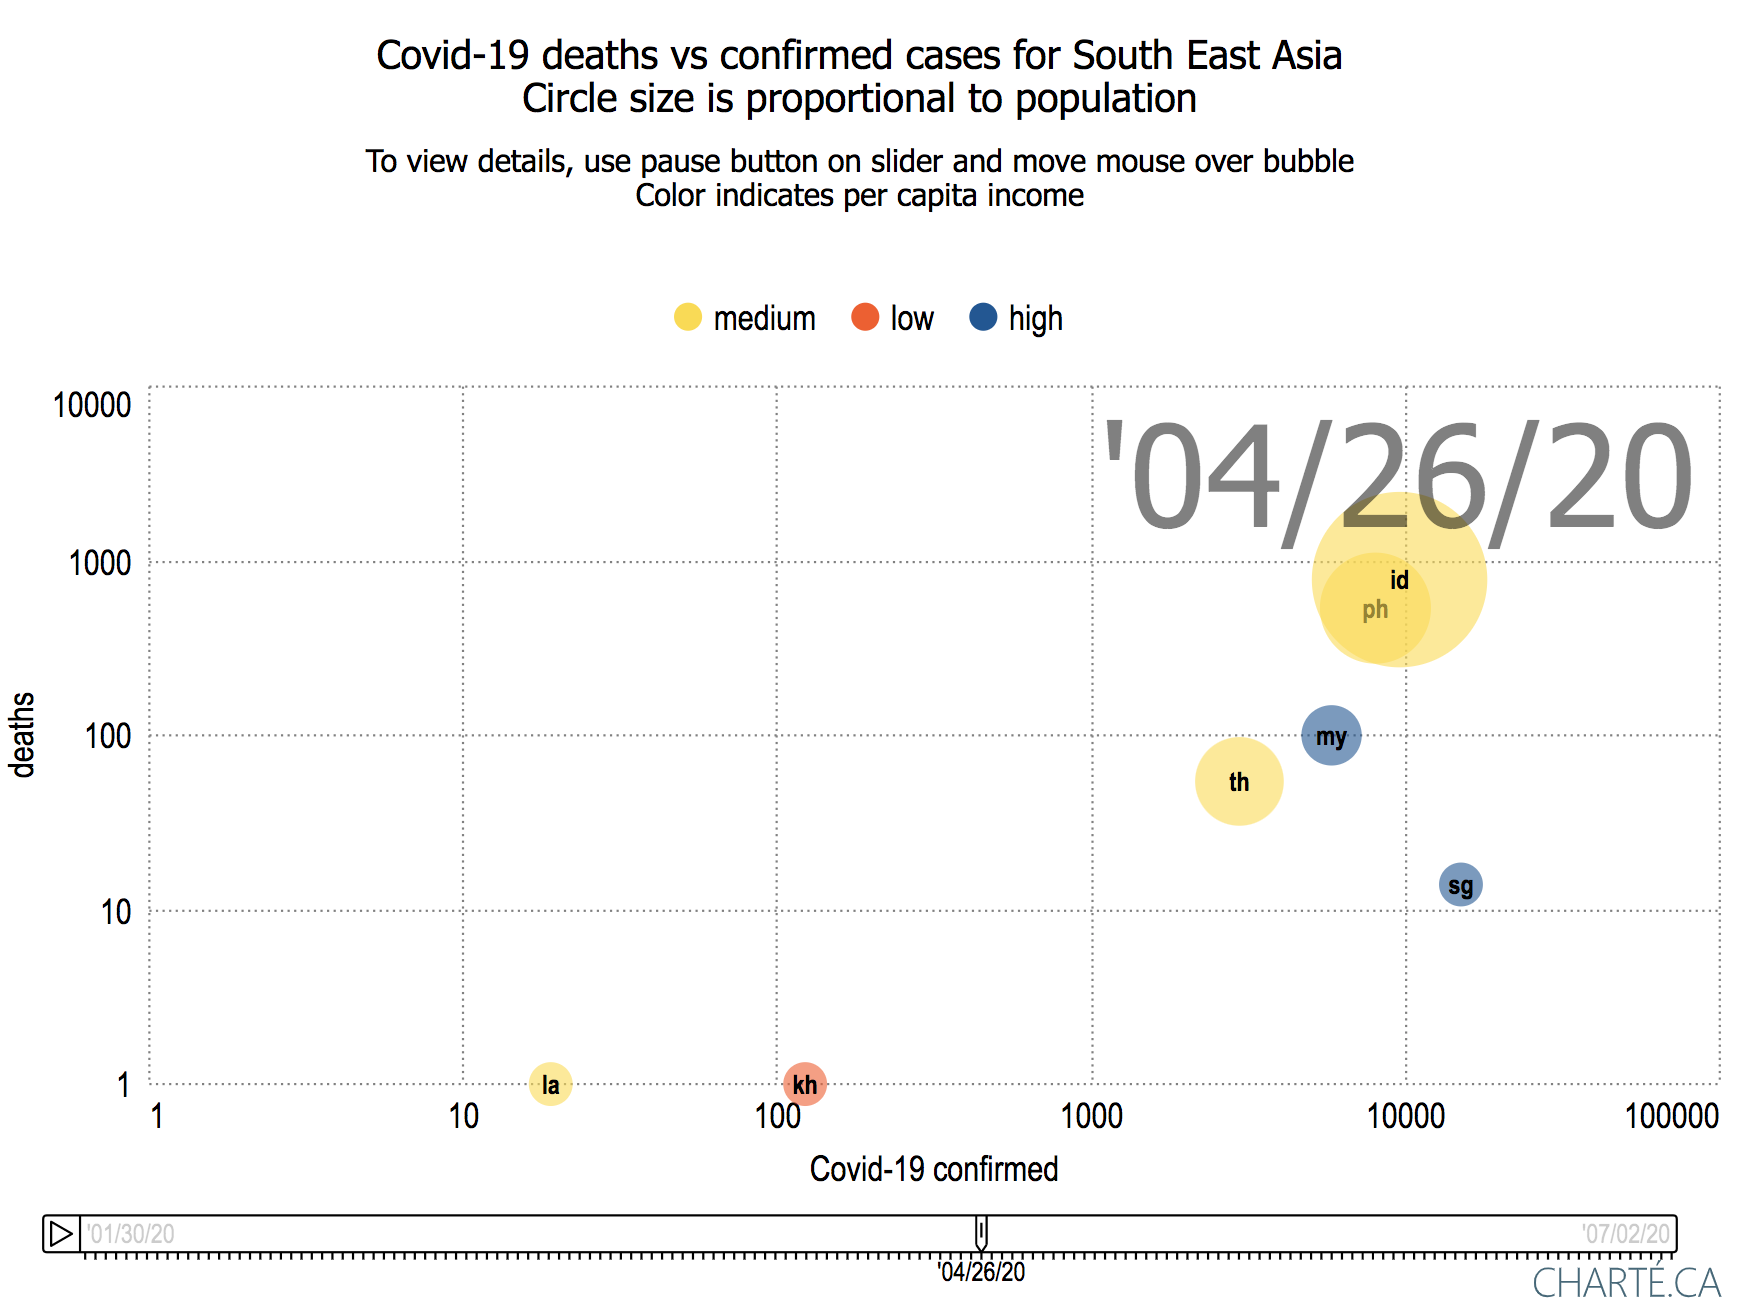
PNG File Screen Shot 2020-07-05 at 7.16.55 PM.png |
211 kB |
Les Cottrell |
Jul 05, 2020 19:21 |
Jul 05, 2020 19:21 |
|
Page: Covid-19 - Visualizing the Africa, Asia, Europe and S America data
|
|
PNG File Screen Shot 2022-03-24 at 2.14.56 PM.png |
211 kB |
Les Cottrell |
Mar 24, 2022 14:15 |
Mar 24, 2022 14:15 |
|
Page: Impact of the Russo Ukraine war on ping response times
|