Content
Experiment
COLTRIMS (Cold Target Recoil Ion Momentum Spectroscopy)
Data
on 2019-06-25 runs 91, 92, 93, 100 requested to restore from tape
/reg/d/psdm/AMO/amox27716/xtc/
exp=amox27716:run=100
event_keys -d exp=amox27716:run=100
Scripts and files
For exp=amox27716:run=100 in LCLS1 environment
- hexanode/examples/ex-quad-00-data.py - simple psana access to data and draws waveforms overlayed on the same plot
- hexanode/examples/ex-quad-01-cfd.py <Acqiris-chanel-number> - test of CFD (Constant Fraction Discriminator) parameters
- hexanode/examples/ex-quad-02-amox27716-0100-acqiris.py - advanced test of CFD with event loop and graphics
- hexanode/examples/ex-quad-07-proc-data-save-h5.py - processes waveforms in dataset and saves results for peaks in file like amox27716-r0100-e060000-single-node.h5
- hexanode/examples/ex-quad-09-sort-graph-data.py
- uses processed data from amox27716-r0100-e060000-single-node.h5 or raw (slow) exp=amox27716:run=100 and calibration files- /reg/d/psdm/amo/amox27716/calib/Acqiris::CalibV1/AmoEndstation.0:Acqiris.1/hex_config/0-end.dat - control anf config file
copy of /reg/d/psdm/xpp/xpptut15/calib/Acqiris::CalibV1/AmoETOF.0:Acqiris.0/hex_config/0-end.data - /reg/d/psdm/amo/amox27716/calib/Acqiris::CalibV1/AmoEndstation.0:Acqiris.1/hex_table/100-end.dat - table with results of the detector calibration
- /reg/d/psdm/amo/amox27716/calib/Acqiris::CalibV1/AmoEndstation.0:Acqiris.1/hex_config/0-end.dat - control anf config file
- hexanode/examples/ex-quad-10-sort-data.py - TBD
Waveforms
hex/examples/ex_acqiris_quad_amox27716-0100.py
Association of channels of AmoEndstation.0:Acqiris.1
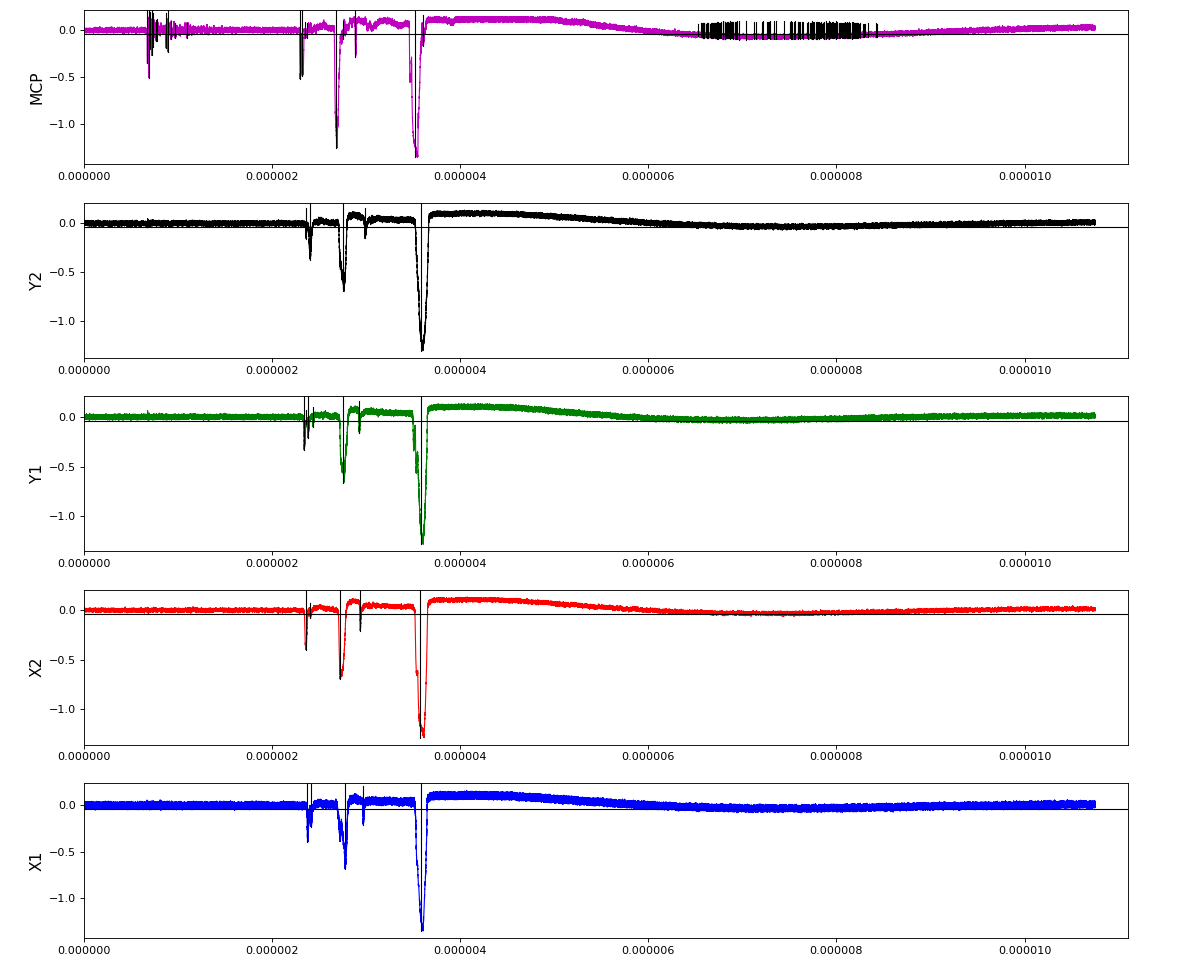
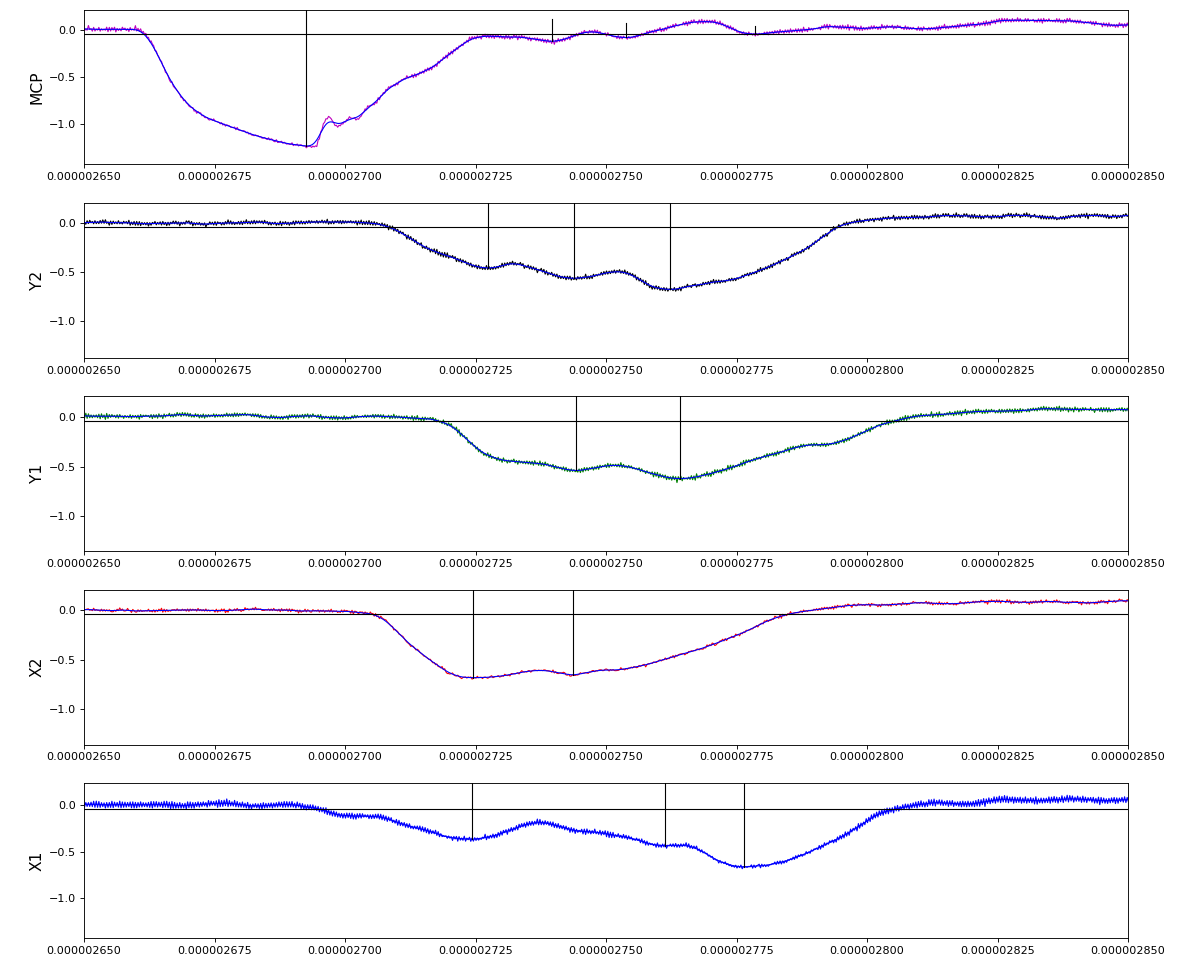
ch = (2,3,4,5,6) - all other channels of Acqiris.1 and 2 are empty or noisy
ylab = ('X1', 'X2', 'Y1', 'Y2', 'MCP')
Other run amox27716 run 91 with lower hit density
Data processing
- hexanode/examples/ex-quad-02-amox27716-0100-acqiris.py - play with waveform parameters and the part of waveform WITHOUT NOISE!
- hexanode/examples/ex-quad-07-proc-data-save-h5.py - set w-f selection parameters data, detector channels, run over data and create hdf5 file.
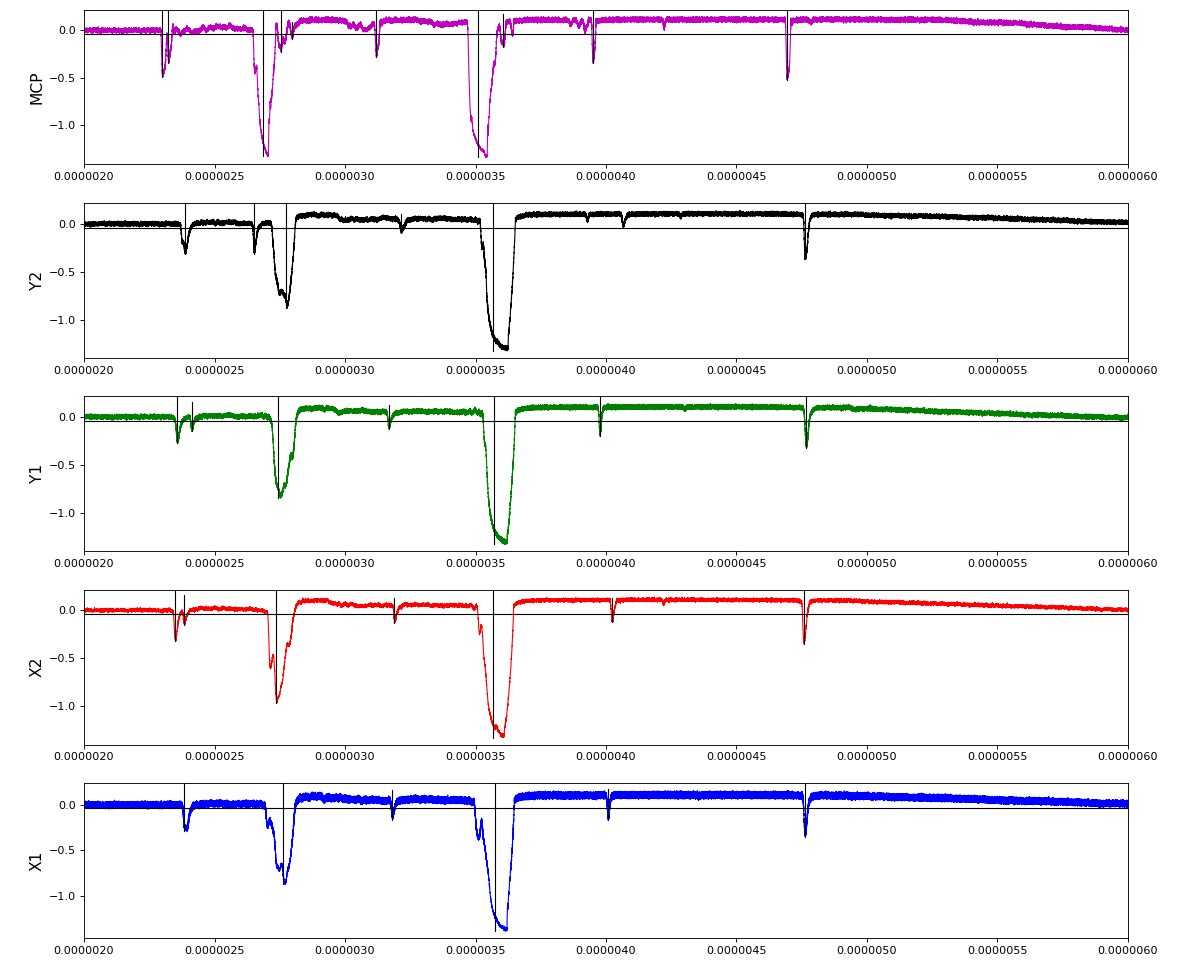
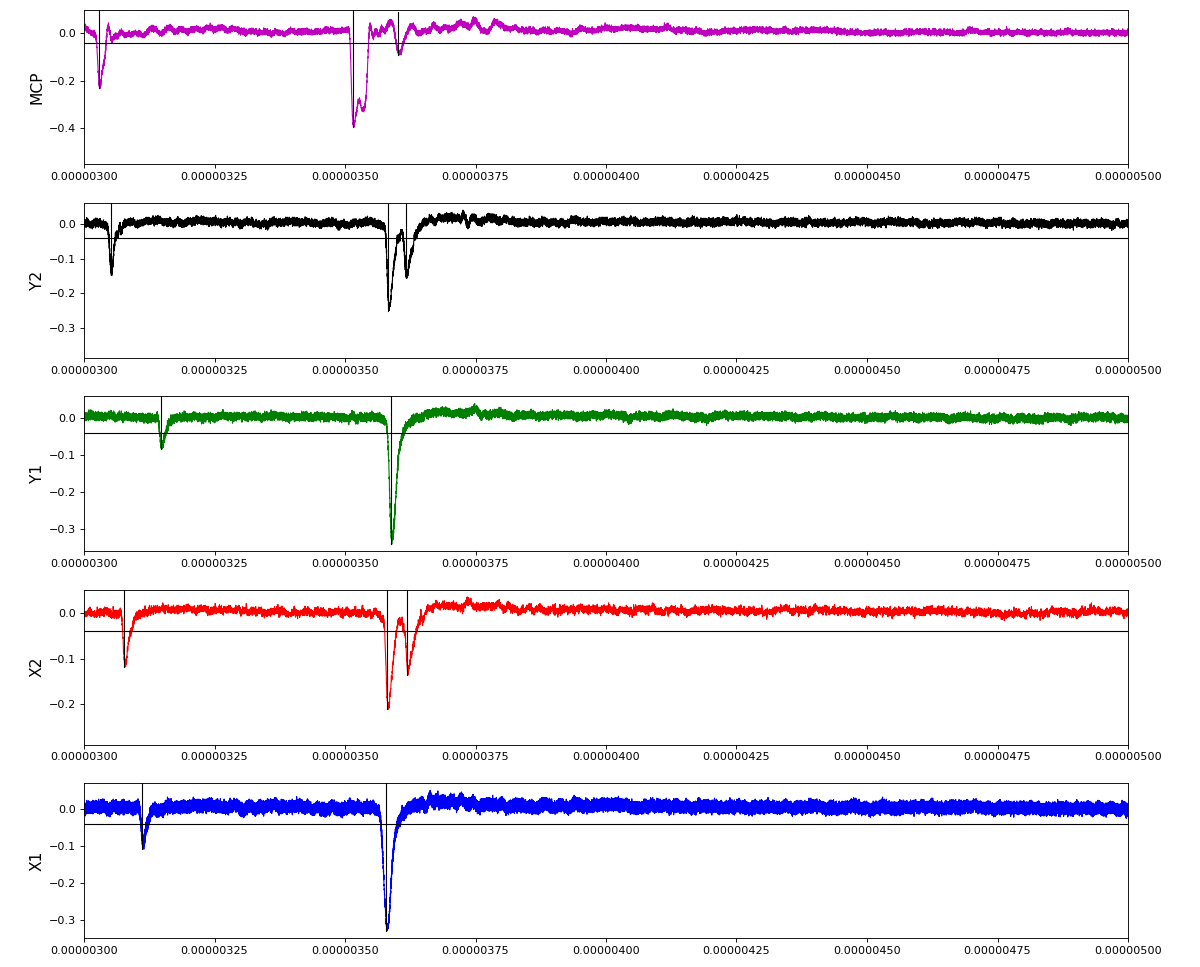
Total waveform with problematic peak reconstruction in MCP channel:
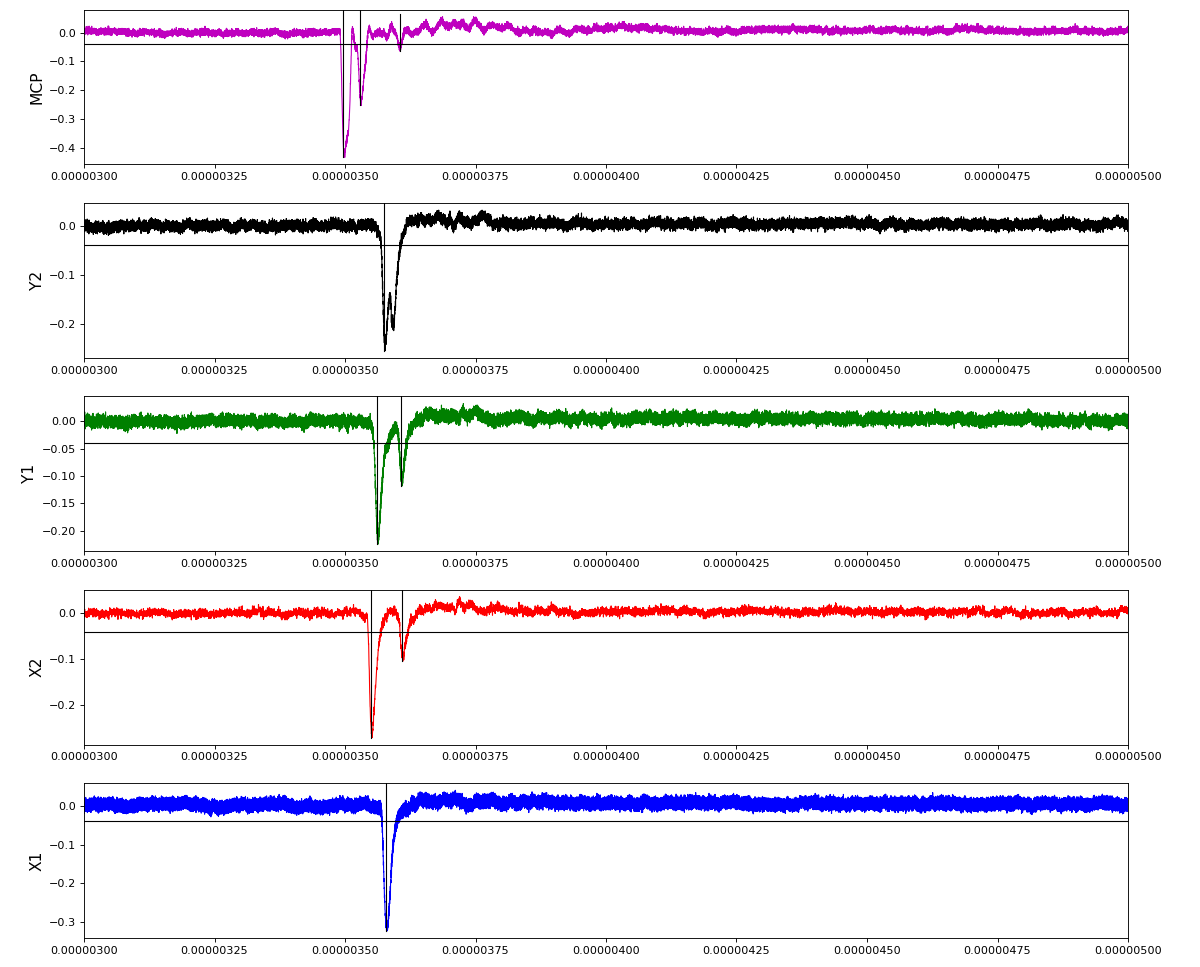
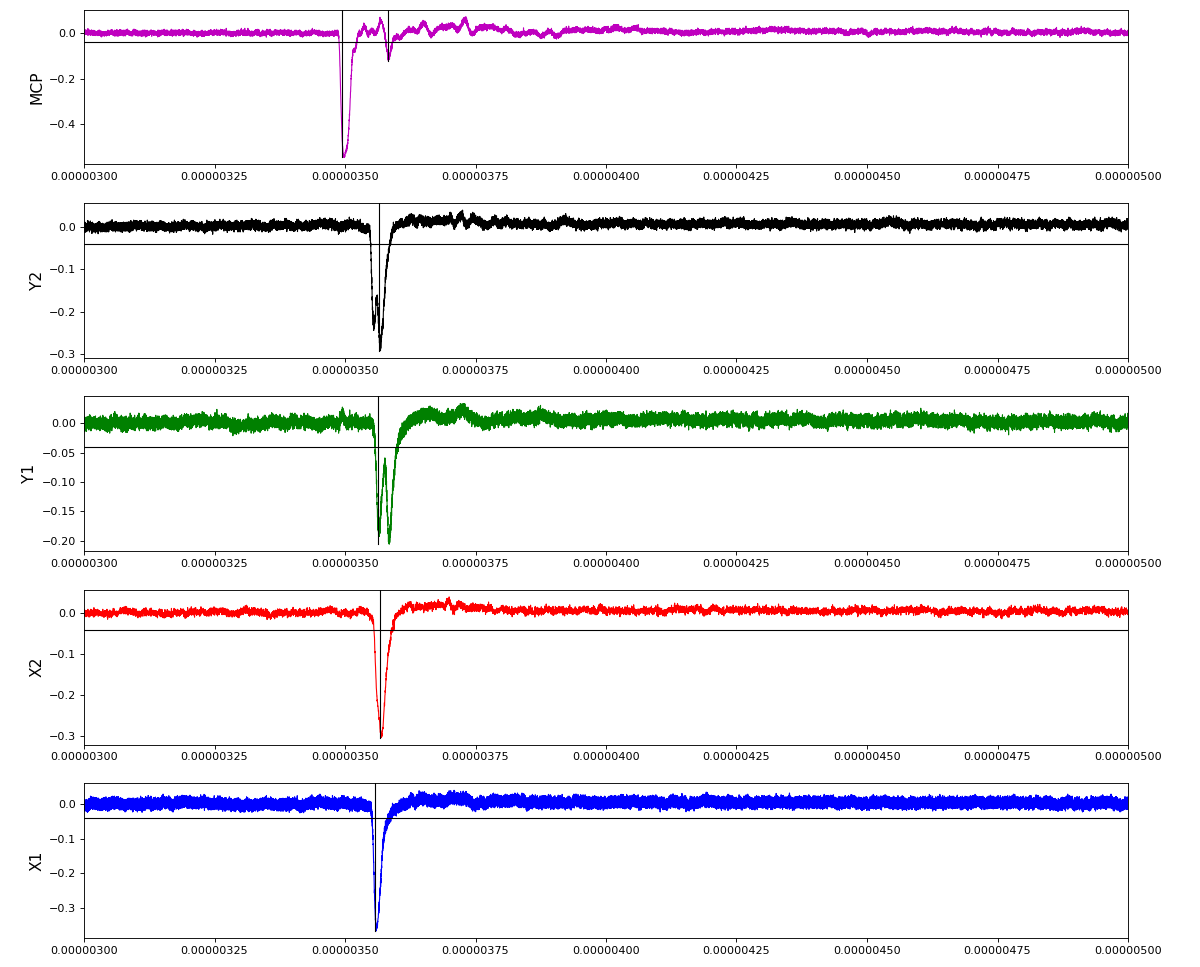
Test of local extreme peak-finder
Version of peak finder searching for local extremes after filtering
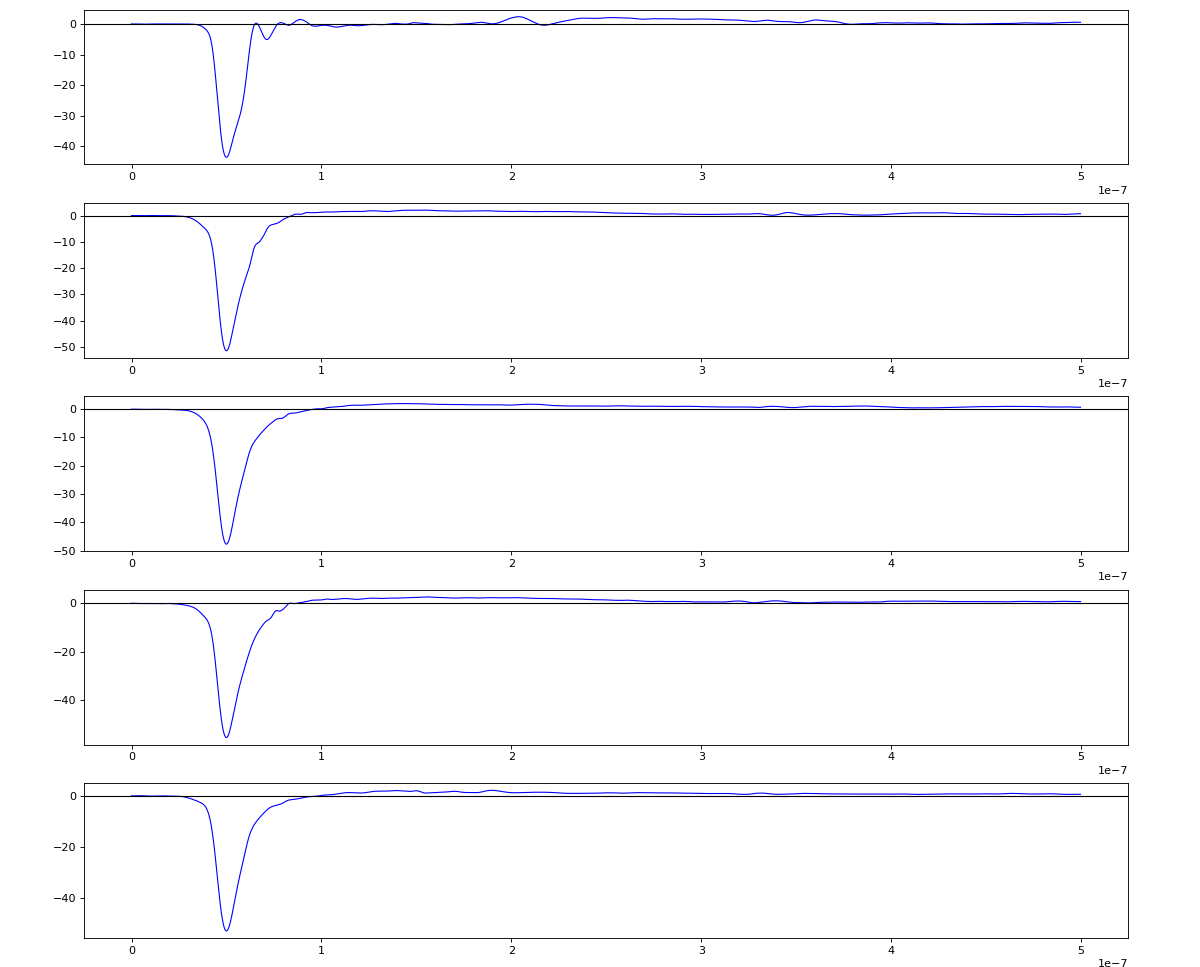
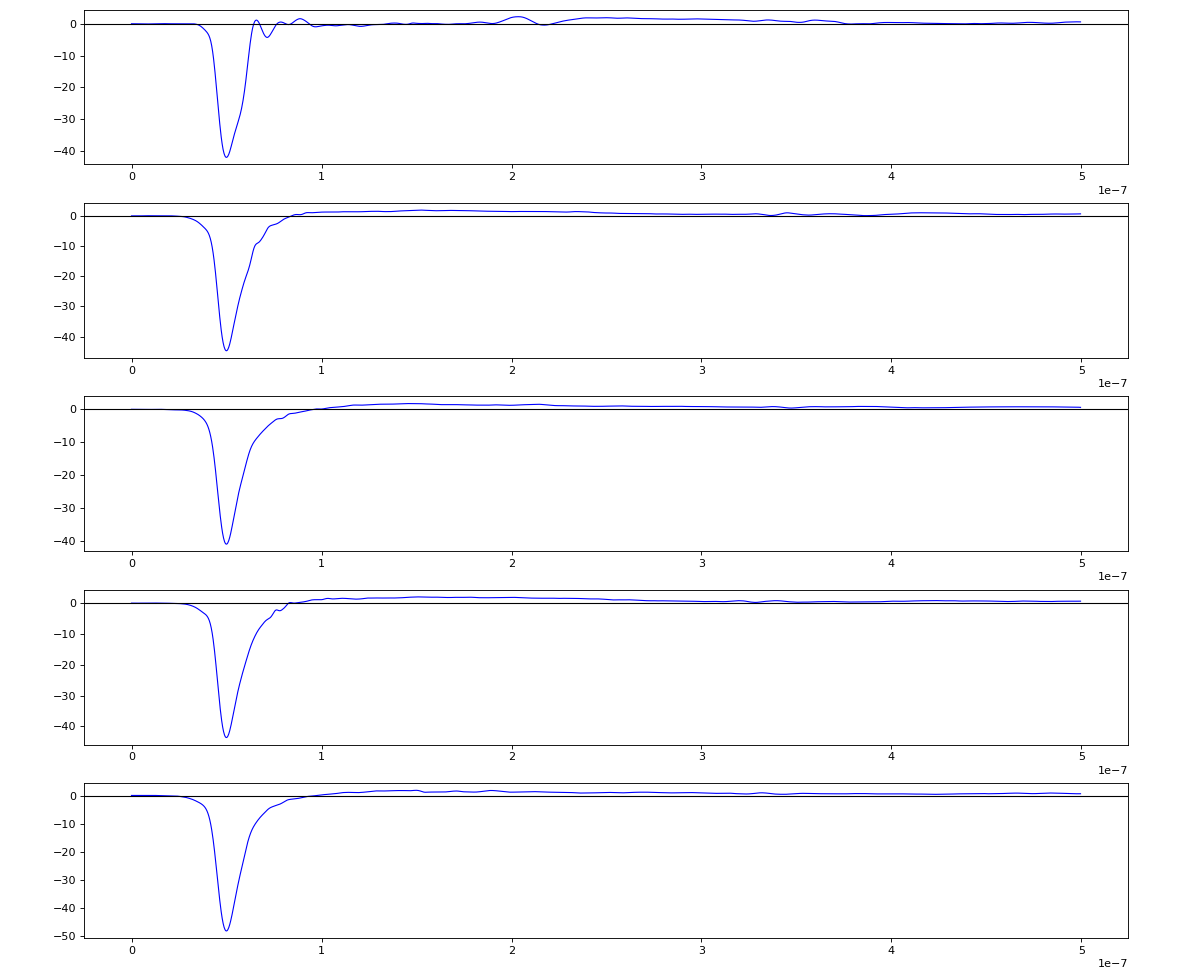
Wavelets estimation
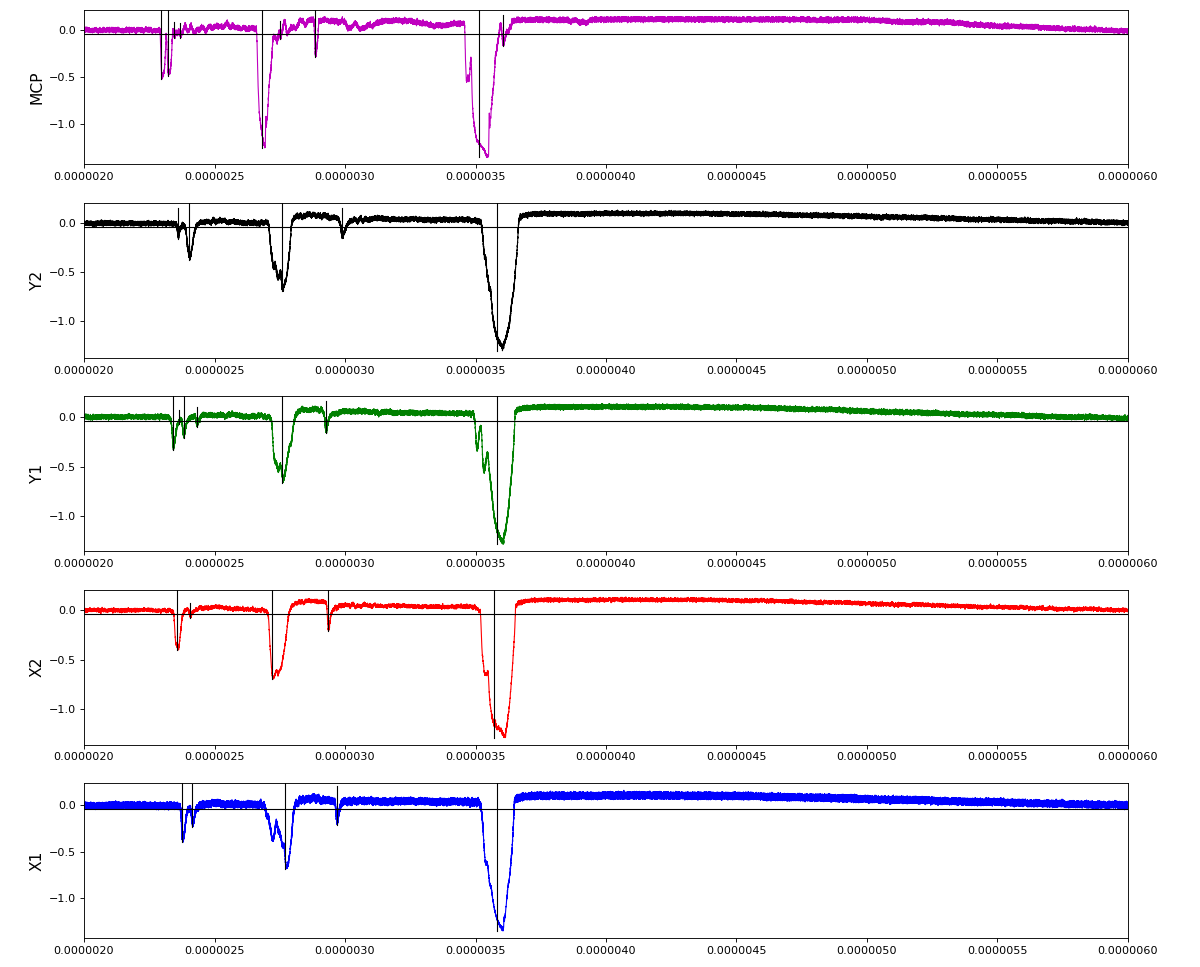
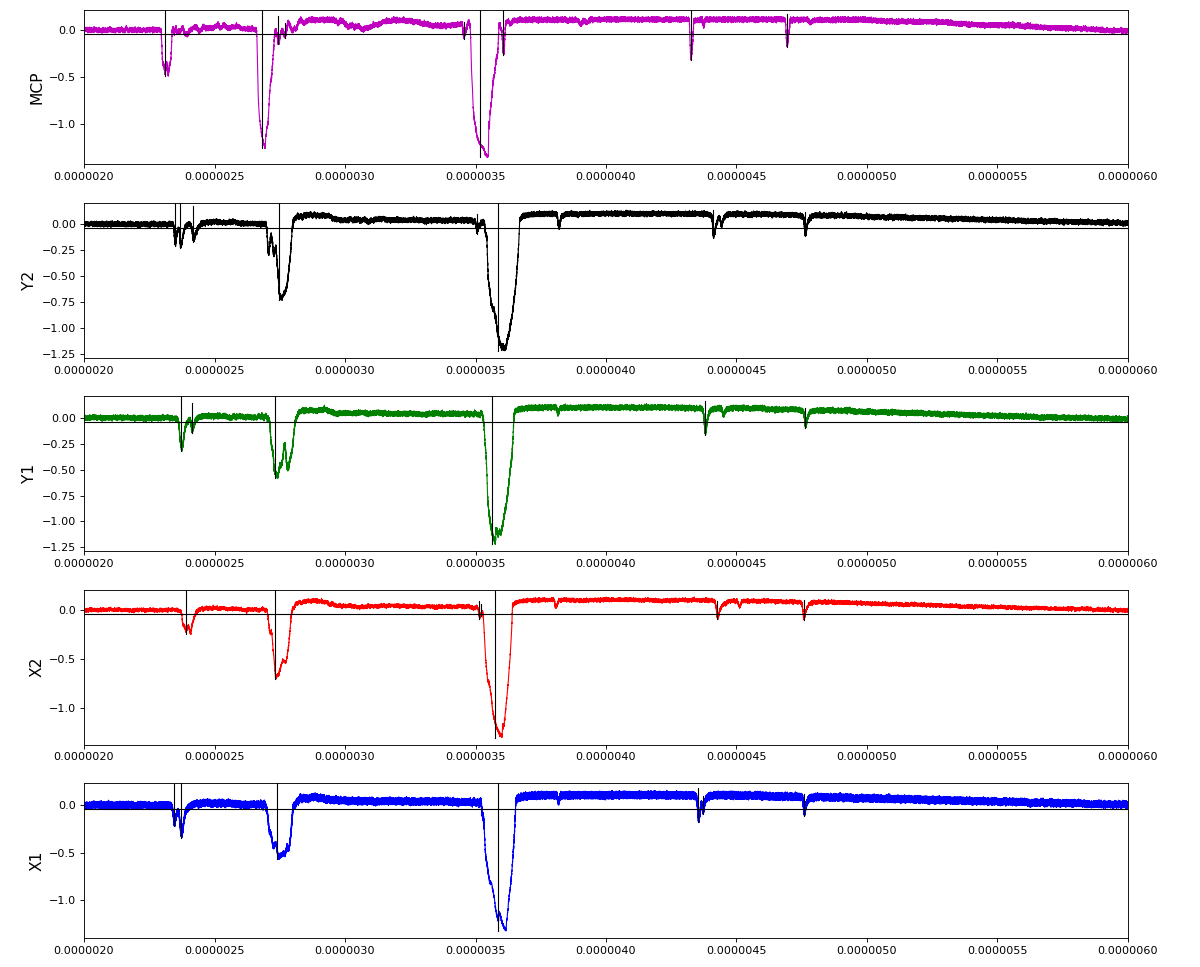
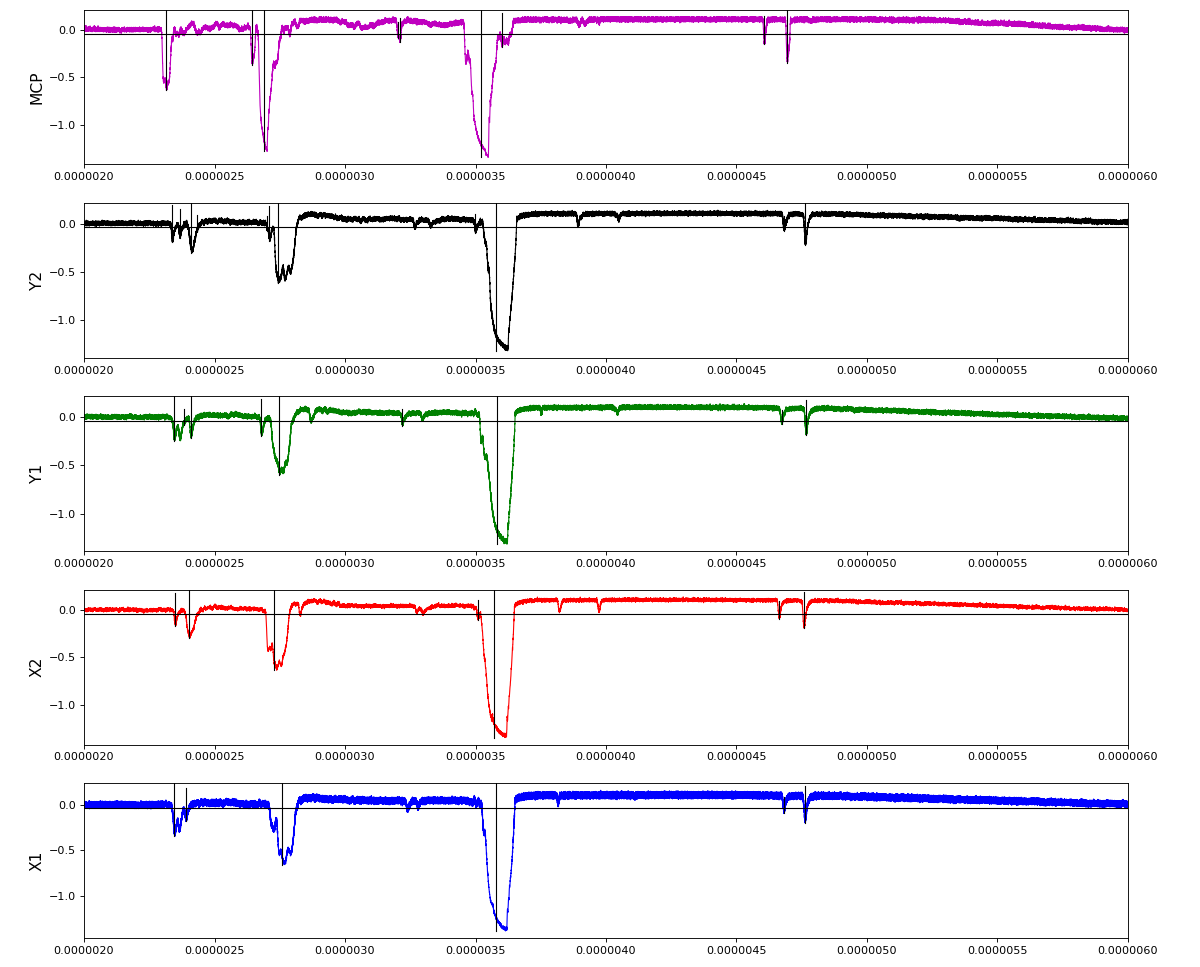
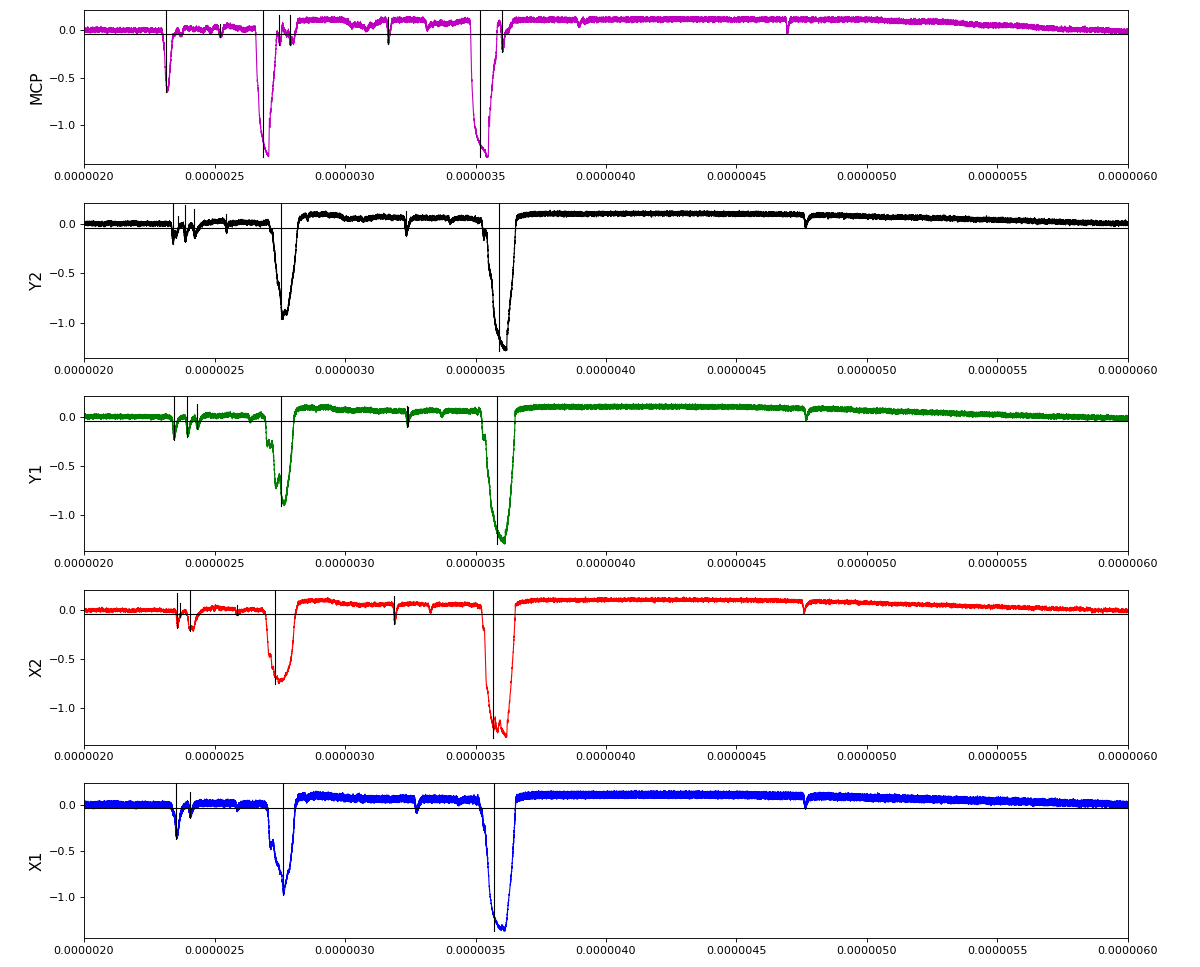
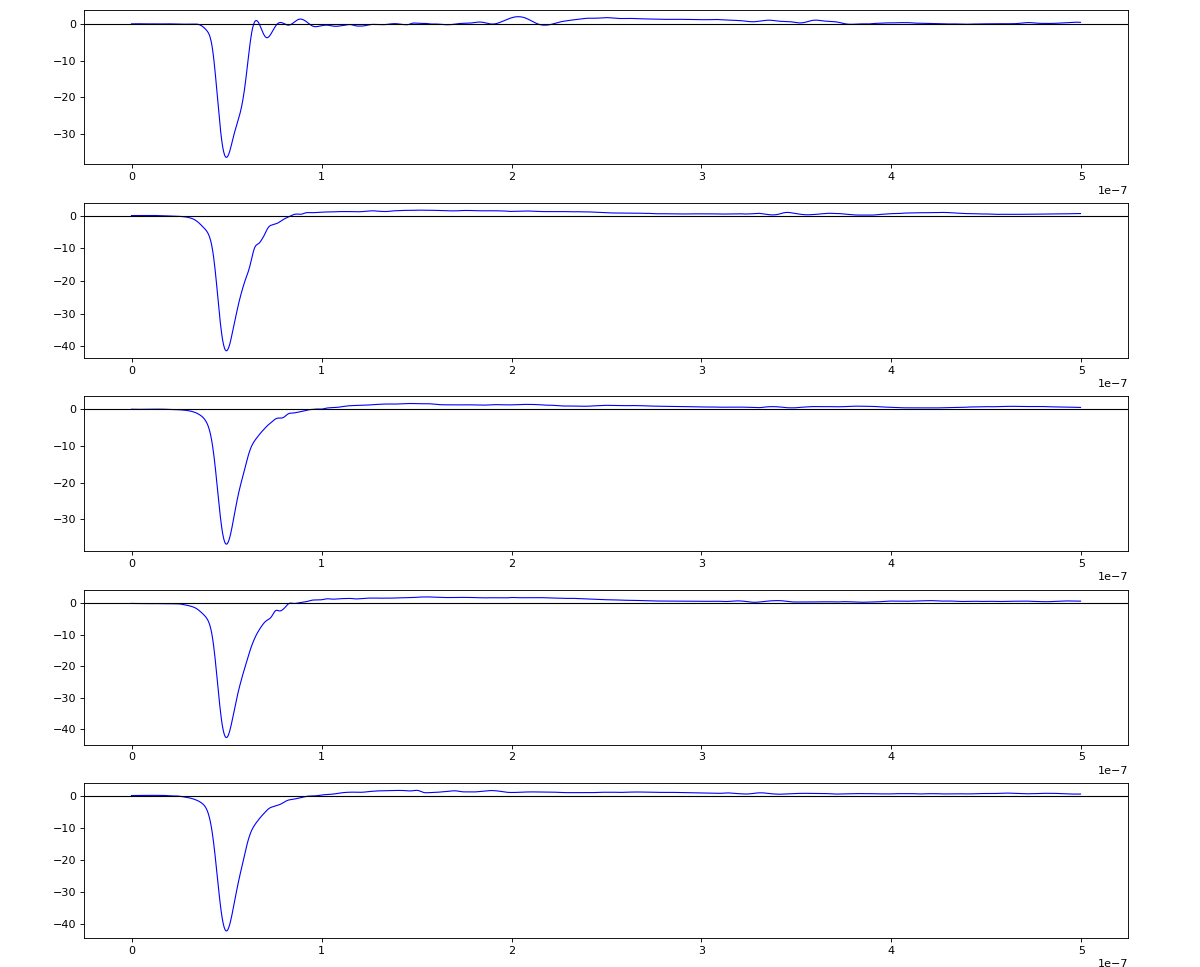
Waveform per channel averaged over 1k raw events with selection of a single peak for amox27716 runs 91,92, and 93
Calibration
- configuration_quad.txt
- Parameters 1129-1135 for channels in hdf5
- command 2: use Time sum U and V plots to set Parameter 1108,1109
- then Halfwidth of the peak in this distribution to set Parameter 1115, 1116
- then Halfwidth of the u(ns), v(ns) distribution to set Parameter 1118, 1119
- manually set scale-factor for layer U and V (mm/ns) Parameter 1102, 1103
- command 3: save file configuration_quad.txt
- command 1: data processing - also set Parameter 1124 in configuration_quad.txt
Plots
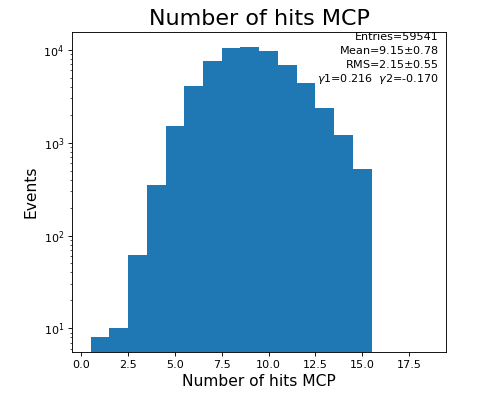
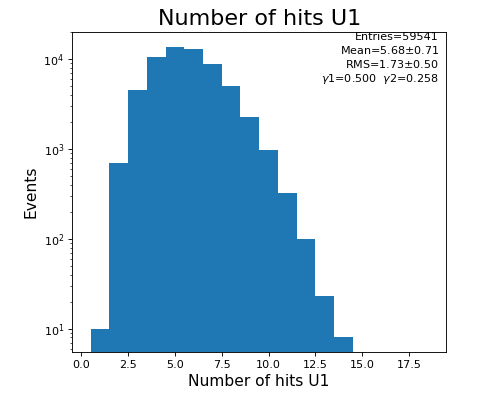
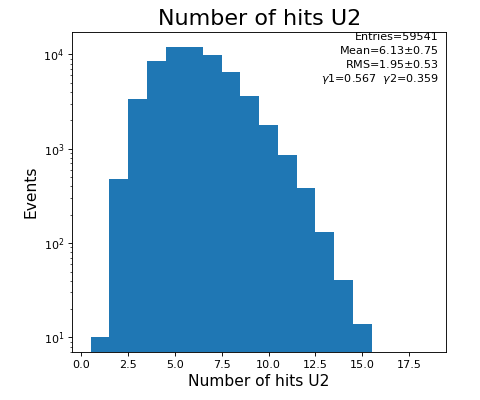
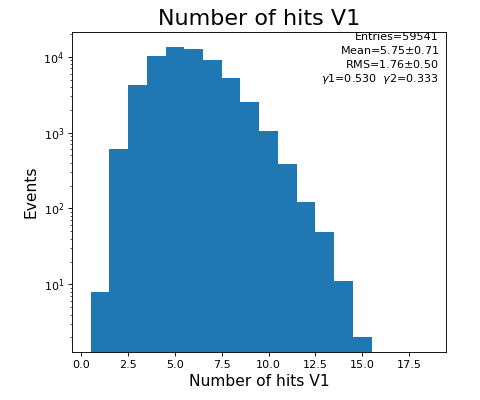
Number of hits per channel

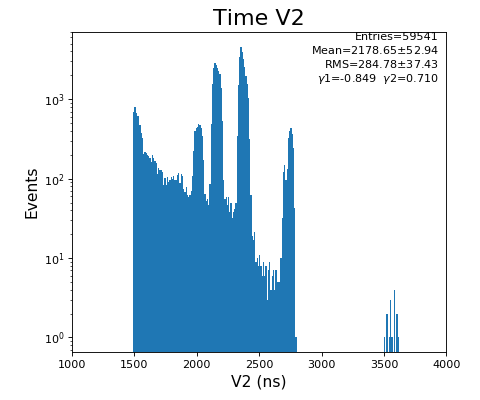
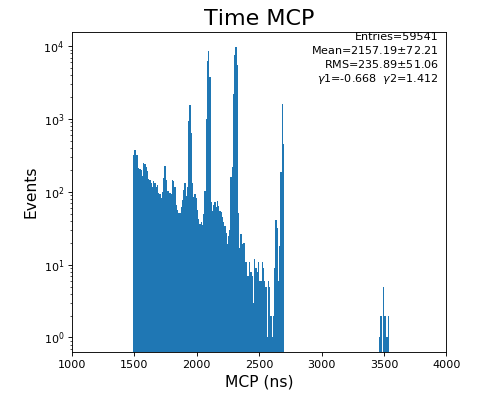
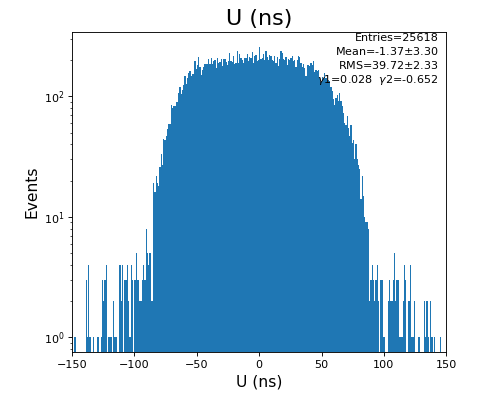
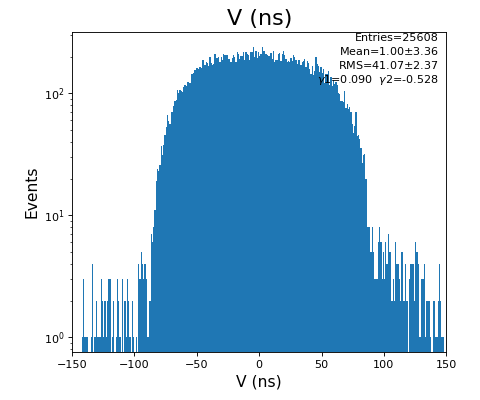
Spectra of time per channel, Spectra of U, V (ns)


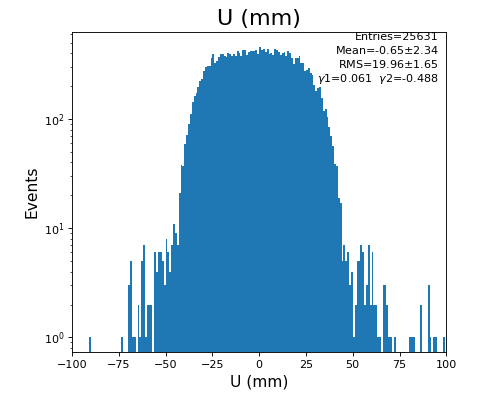
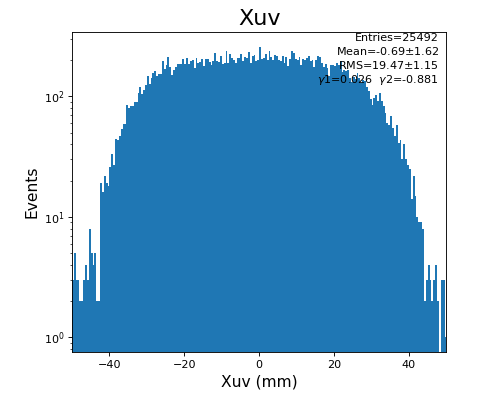
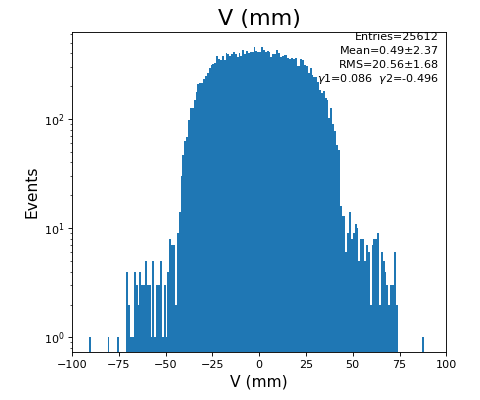
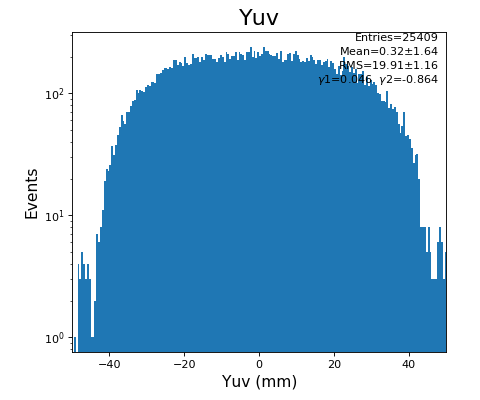
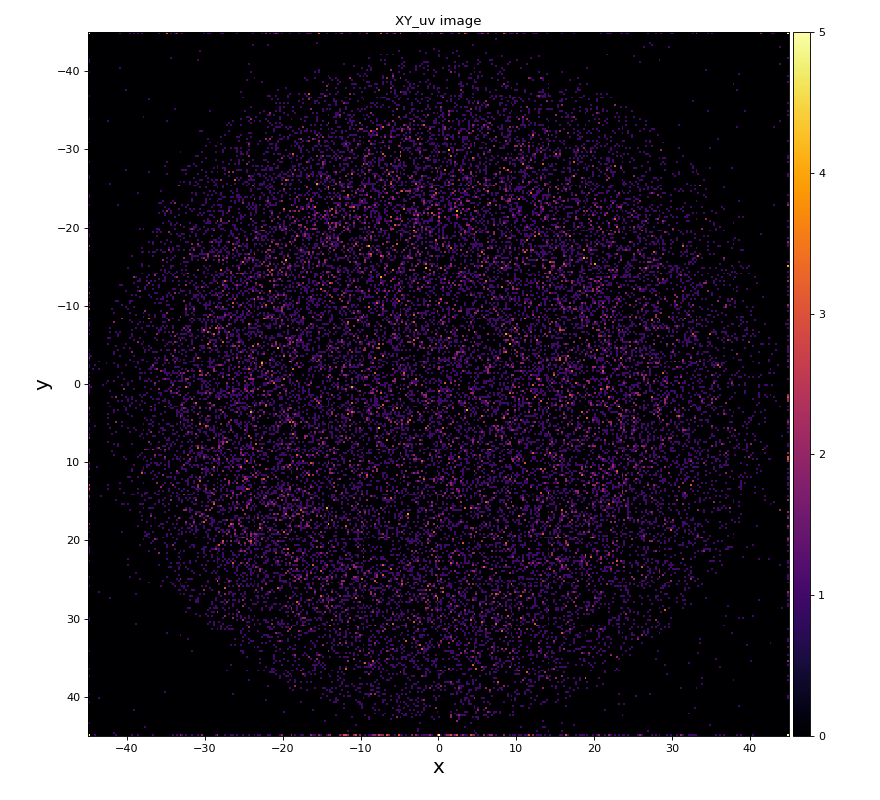
Spectra of U, V (mm)
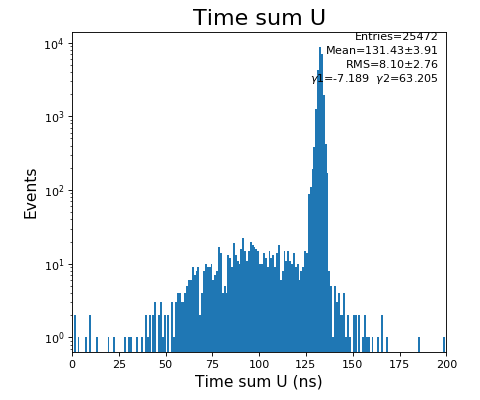
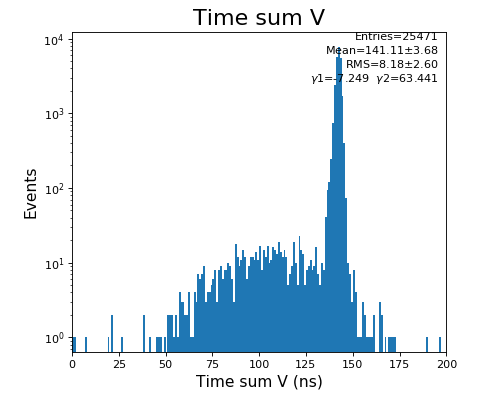
Time sum (ns) for U, V
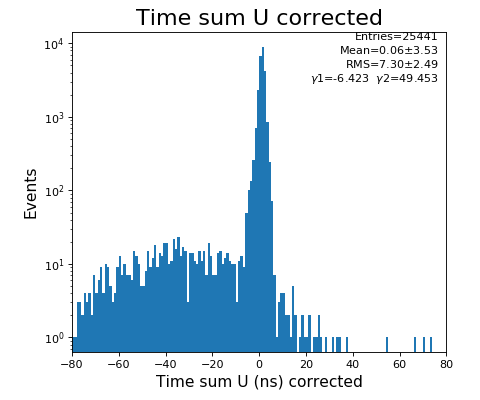
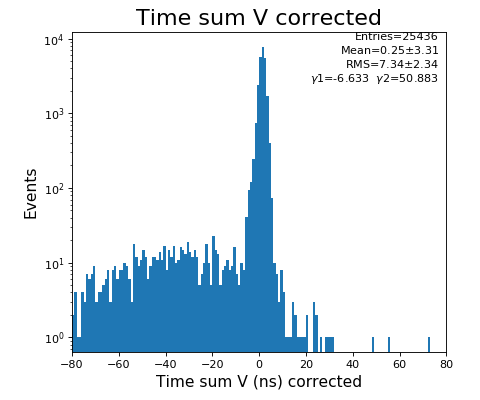
Time sum (ns) corrected for U, V
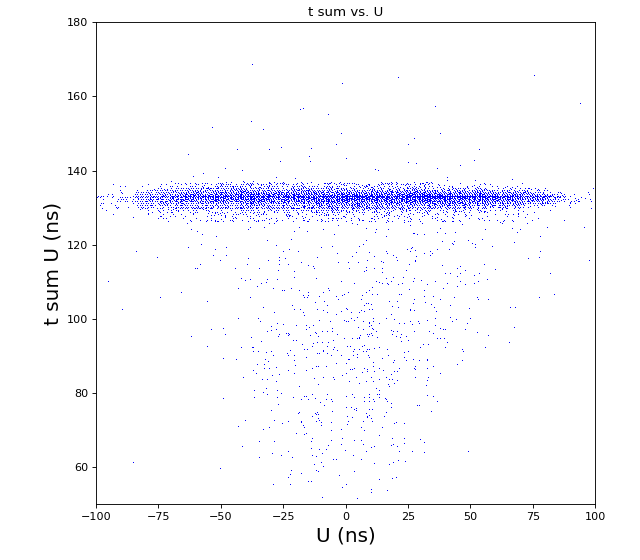
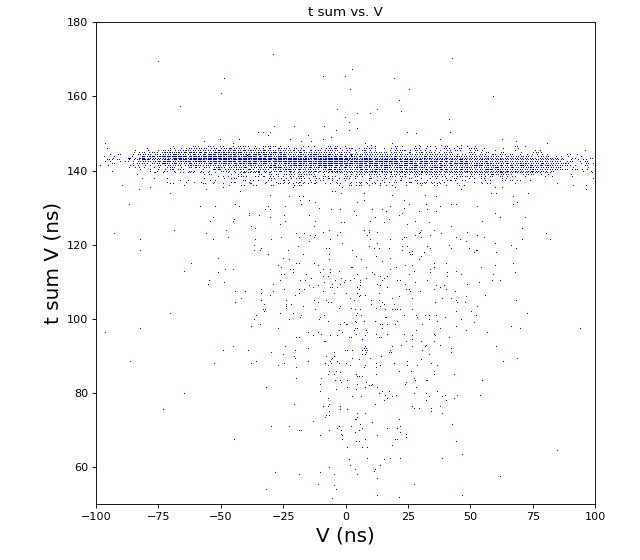
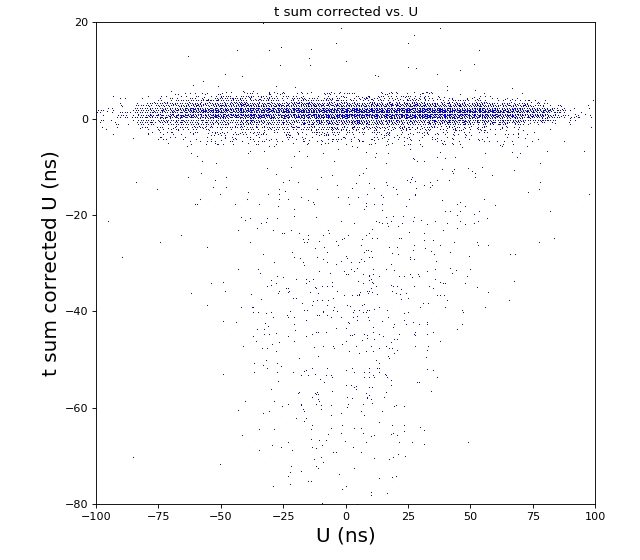
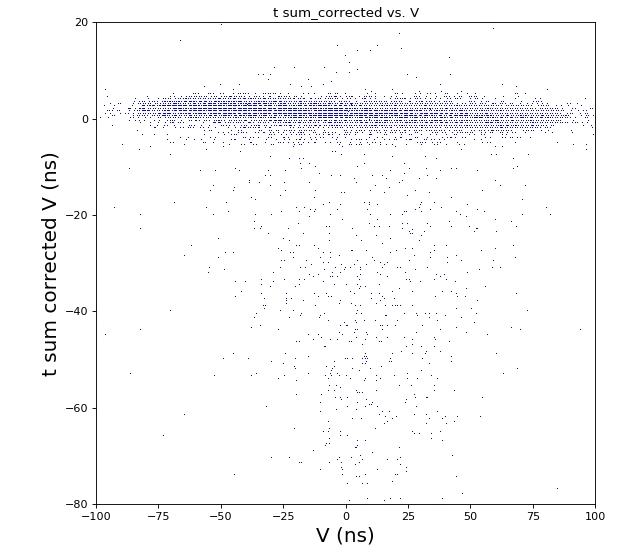
Time sum vs. variable U, V
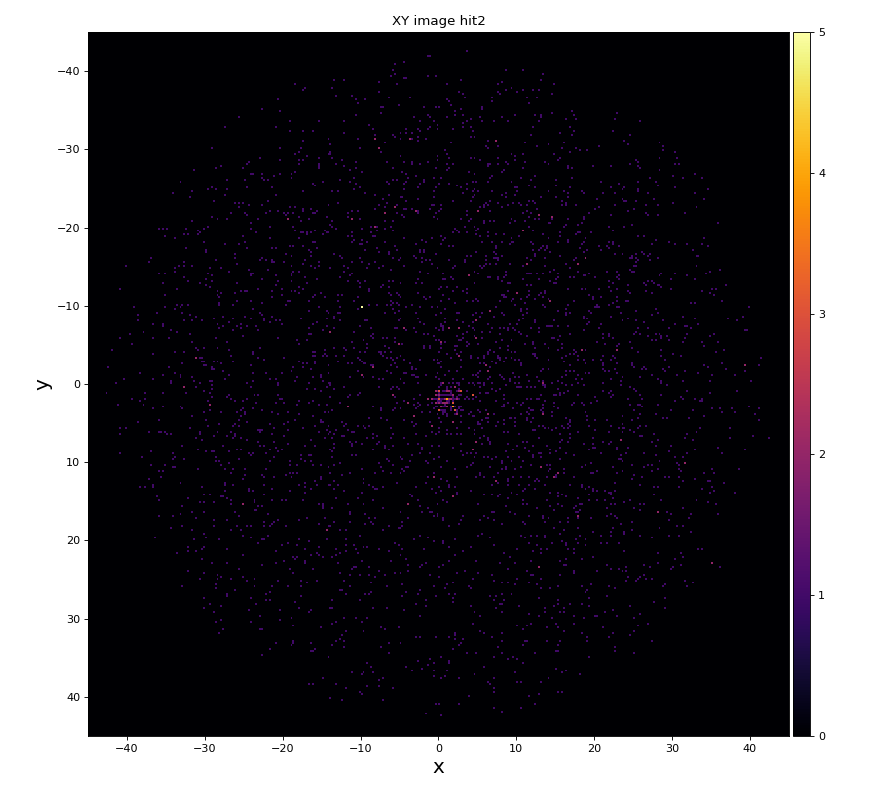
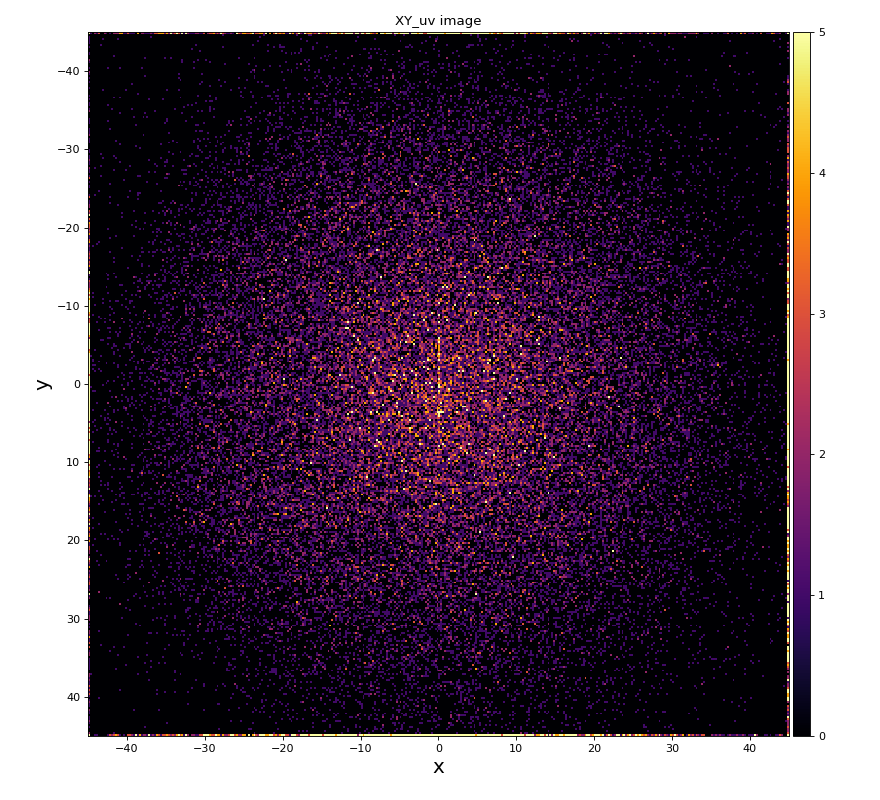
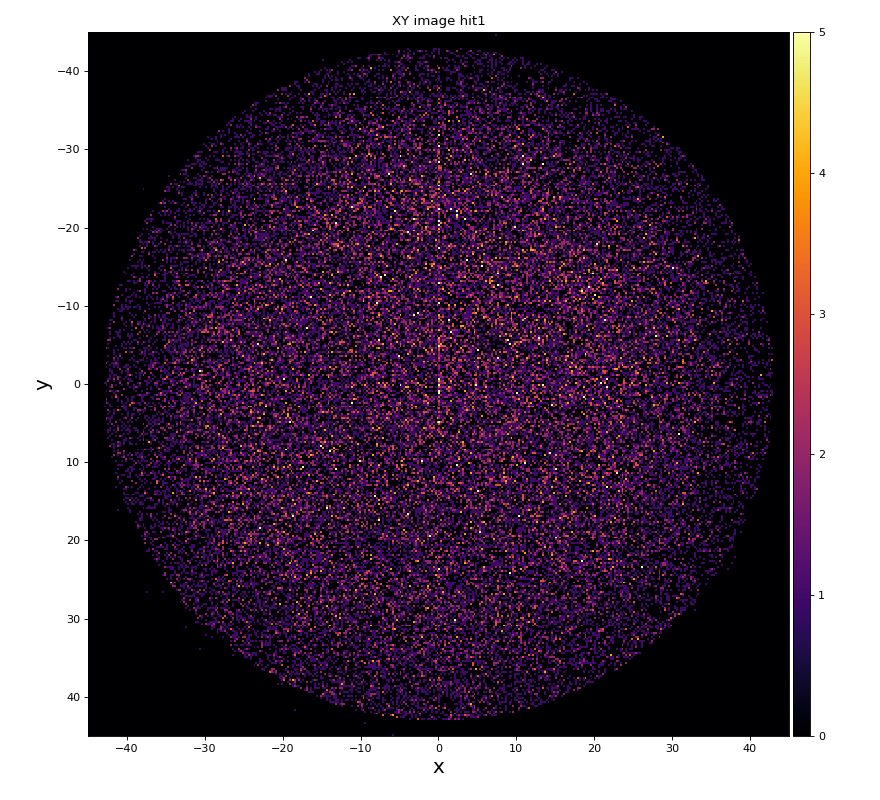
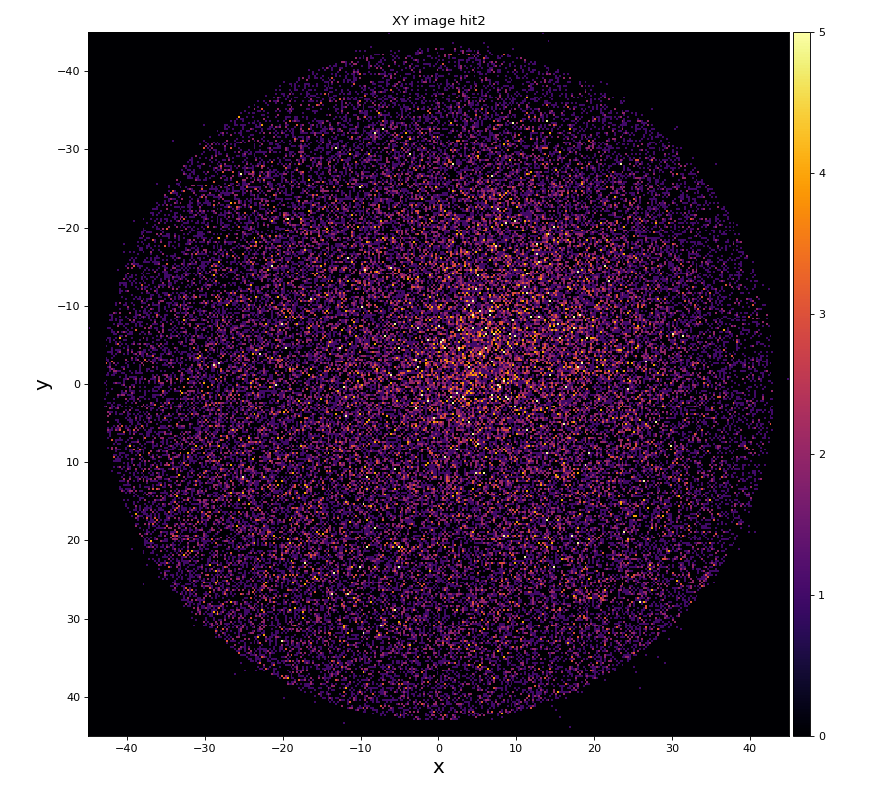
xy image for hit1 and 2

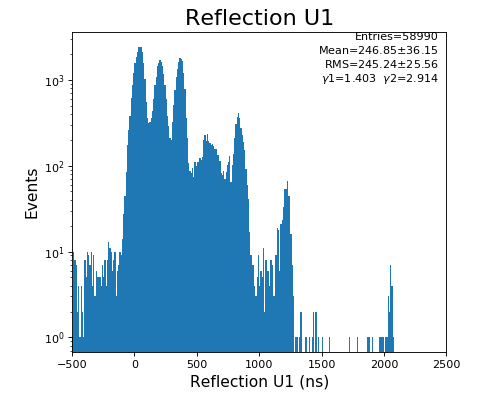
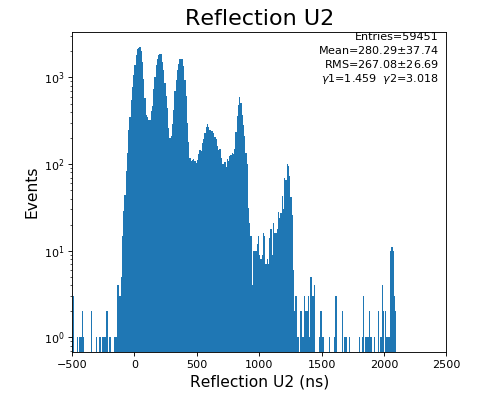
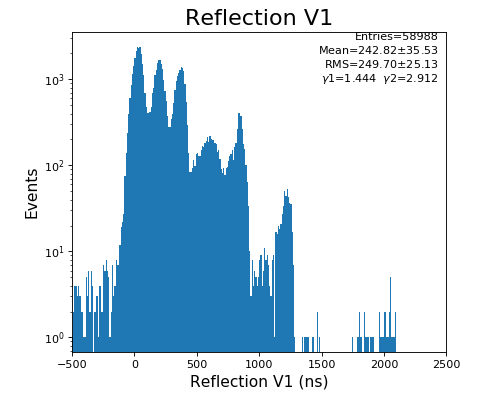
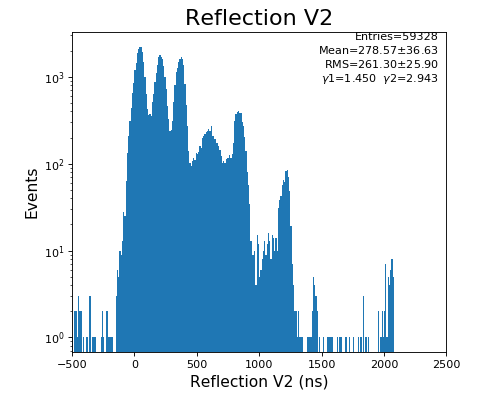
Reflection for all channels
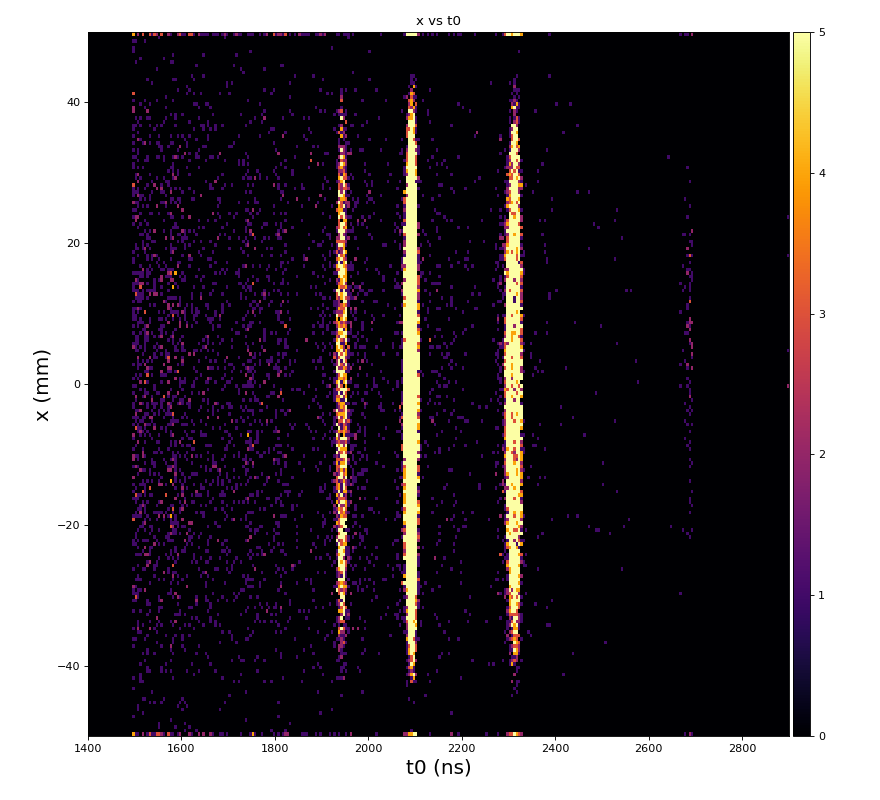
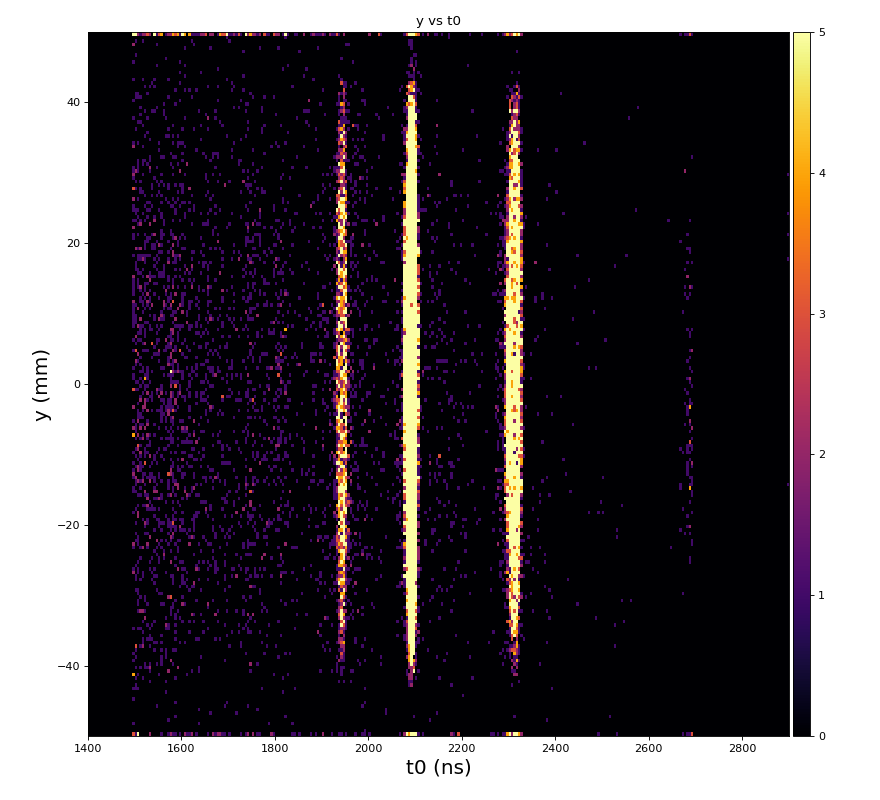
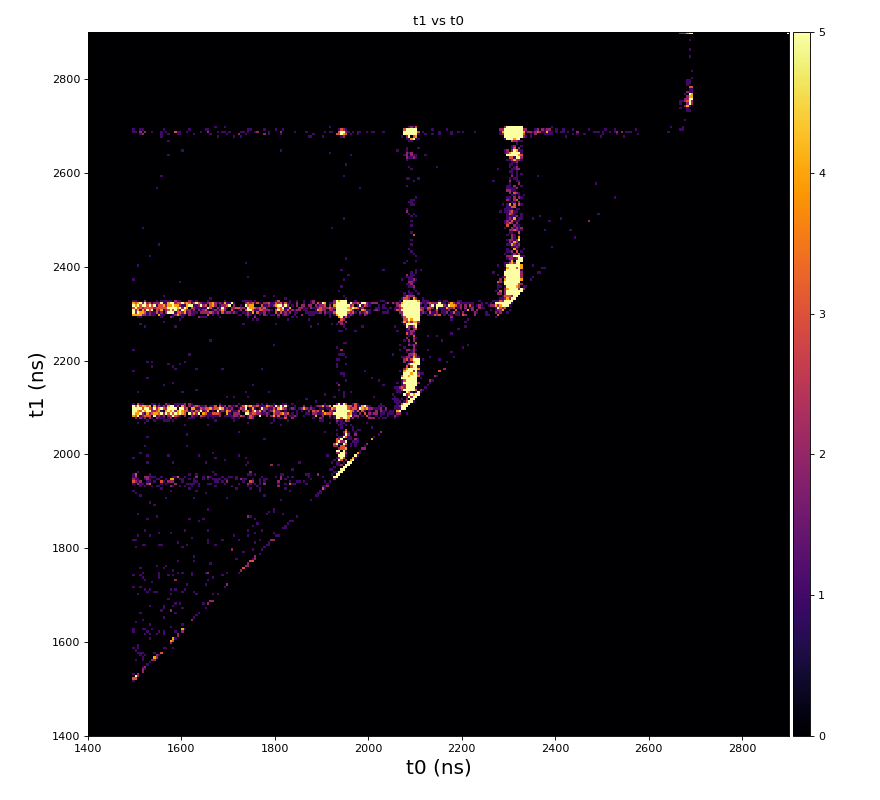
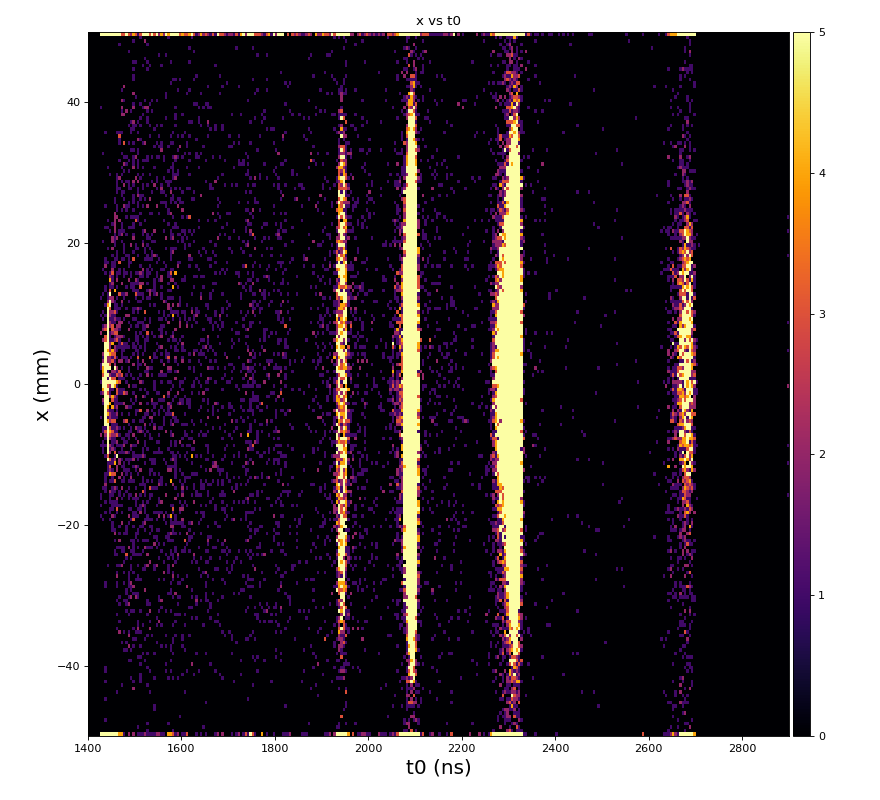
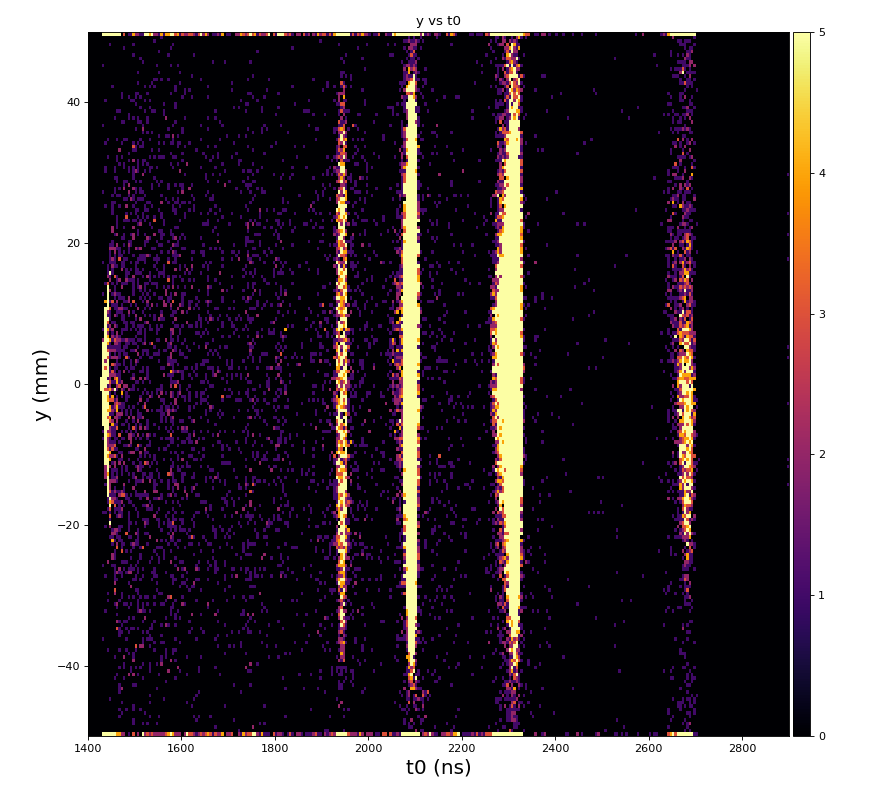
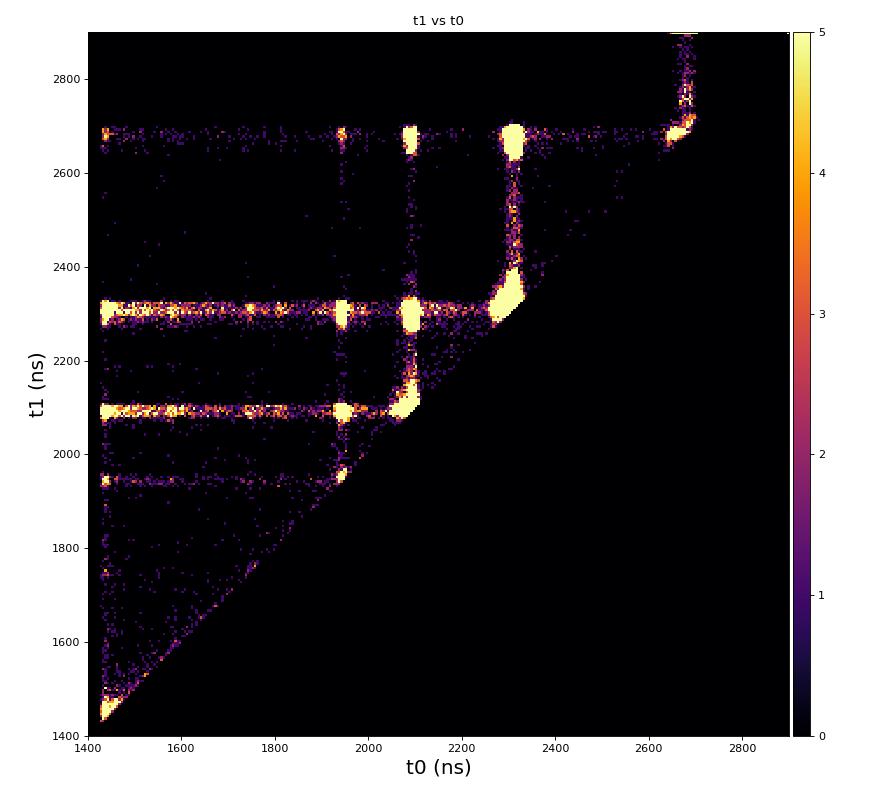
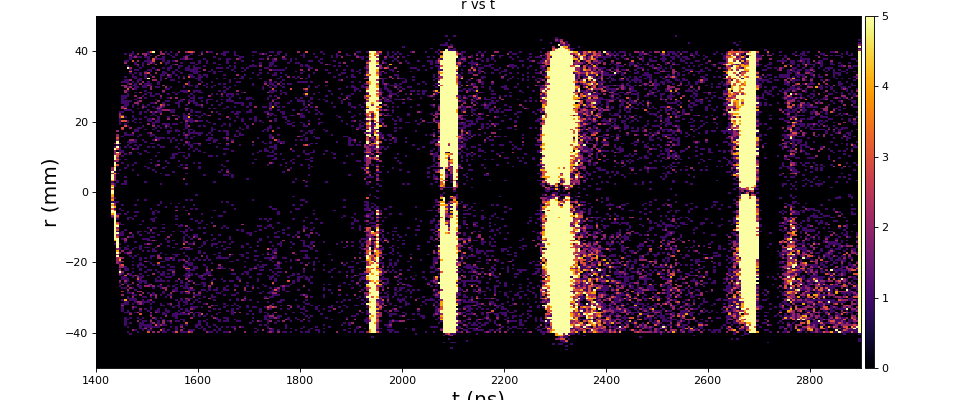
Physics plots t1,x,y vs t0
Calibrated plots
hexanode/examples/ex-quad-09-sort-graph-data.py with command 1 (after calibration command 2,3) set in configuration_quad.txt.
Soft on LCLS2
Examples
https://github.com/slac-lcls/lcls2/blob/master/psana/psana/hexanode/examples/
- ex-20-data-acqiris-access.py - access to detector waveforms
- ex-21-data-acqiris-graph.py - plot waveforms and found peaks
- ex-22 - 24 - intended for calibration and representative graphics
- ex-25-quad-proc-data.py - reads waveforms from xtc2, find peaks, and reconstruct hits using Roentdec library
Physics plots
From ex-23-quad-proc-sort-graph-from-h5.py or ex-24 if xtc2 file is available:
References
- Hexanode detector test on data
- Hexanode users' examples
- TMO data flow spread sheet
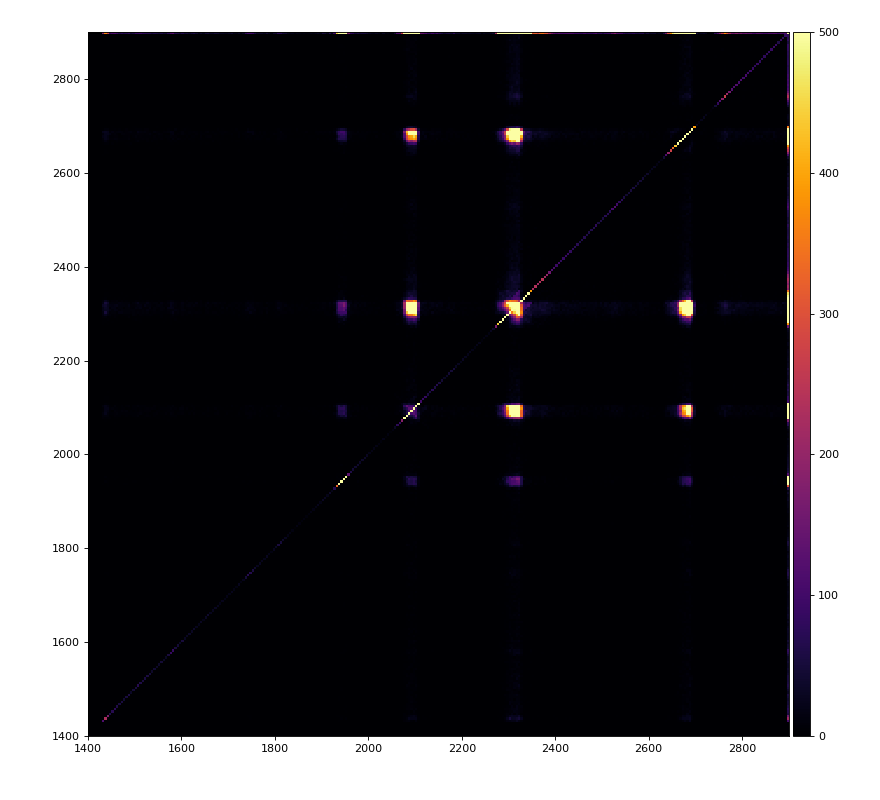
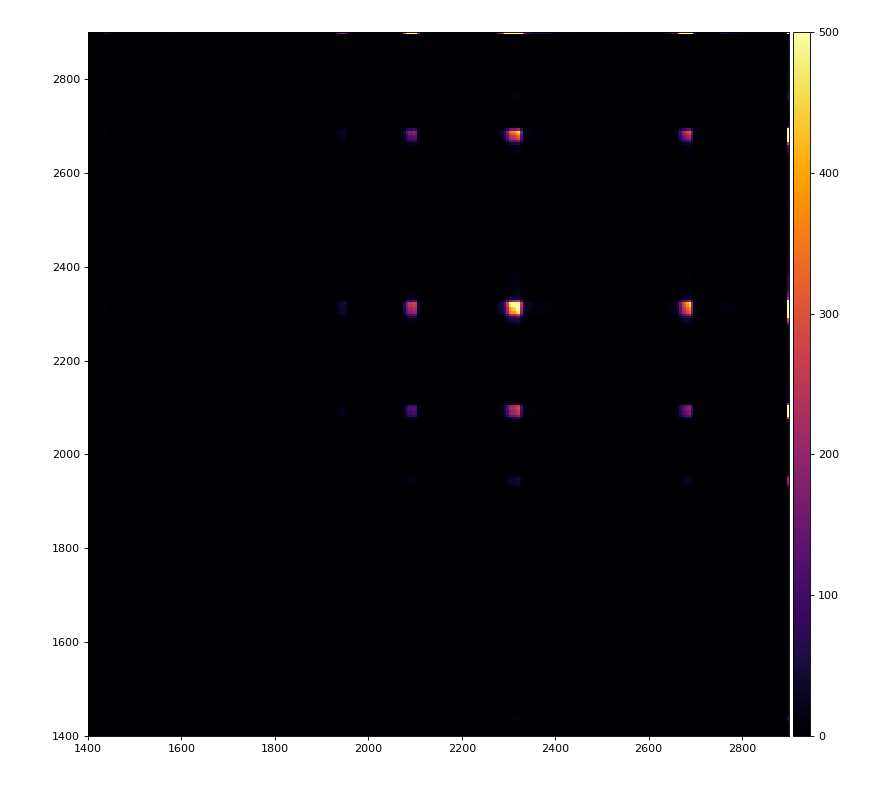
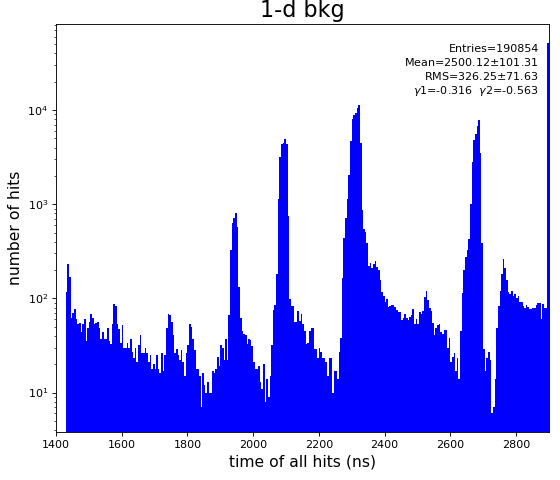
- Covariance mapping
- 2019-11-01-Peter-Walter-article.pdf
Overview
Content Tools