Table of Contents
Features
Calibration Management Tool is intended to help in population of the calibration database. Most of imaging devices need in intensity corrections such as dark rate subtraction, per-pixel gain factor, masking of bad pixels etc. Some of imaging devices composed of separate sensors (a.k.a. tiles, segments, pixel matrices, etc.) such as CSPAD need in pixel geometry calibration parameters. There are many separate scripts in python, psana framework, etc. which allow to get calibration files for different imaging devices. However, it is not easy to set correct parameters in order to run these scripts. One has to be careful in selection of input experiment name, run number, device name(s), to set correct chain of processing algorithms, and finally define the correct destination path for calibration files. Calibration Management Tool greatly simplify this task. It is designed to integrate access to many separate scripts under single Graphical User Interface (GUI), it takes care about all variables and names, which can be selected from drop down menus, it helps to perform calibration and deploy calibration files in correct final directory with correct names.
Calibration Management Tool main functionality can be listed as follows:
- helps to select and set instrument, experiment, and detector(s) which need to be calibrated,
- easy switch between different tools such as Dark, Gain, Geometry calibration, ROI mask editor, File manager, etc. (not necessarily all of them are implemented),
- issue necessary commands to operation system or submit jobs in batch to perform calibration algorithms on data and get files with calibration parameters,
- perform control and monitoring of the batch jobs,
- perform monitoring of the calibration file quality,
- deploy obtained or available calibration files in right sub-directories under
/reg/d/psdm/<instrument>/<experiment>/calib/with right names associated with a run range.
Implementation
User Interface (UI) of Calibration Management Tool is implemented in Python using standard external packages PyQt4, matplotlib, etc. and packages from offline software release (starting from ana-0.10.10):
CalibManager- most of User Interface (UI) modules and implementation of the launching commandcalibmanPyCSPadImage -image processing modules for CSPAD,CSPadPixCoords-C++ psana modules for CSPAD data access,ImgAlgos- C++ psanamodules for calibration in batch jobs,CorAna -modules forMask Editor,etc.
Users' Interface
Main window of the of the Calibration Management Tool is launched by the command calibman. Its content may be different for the first and next sessions; current session status is preserved in configuration file at exit and restored at start of the next session (if this option is elected in configuration parameters). For example, UI with Dark tool is shown below.
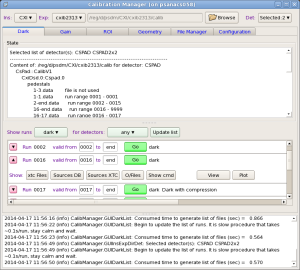
Main window of UI consists of three panels from top to bottom:
- Instrument/Experiment/Detector selection panel,
- Tab-bar with switching application panel,
- Log-book information panel.
Instrument/Experiment/Detector selection panel
Instrument/Experiment/Detector panel is located on the top of the main window.

This panel contains three selection buttons with preceded labels for
Instrument,Experiment, andDetector,
which help to set associated parameters. Each of these buttons must be sequentially clicked and desired value should be selected from drop-down menu. After experiment name is selected, the default calibration directory appears in the next-right information field. This top-level calibration directory will be used as a destination path for deployment of all calibration files. Optional button Browser launch directory selection dialog window which allows to set different from default destination calibration directory. At first setting the sequence of operations in this panel is guided by the next enabled green button. Already enabled buttons can be re-selected at any time. For tools like Dark or Gain the list of calibrated detectors is selected by the check boxes in the pop-up panel
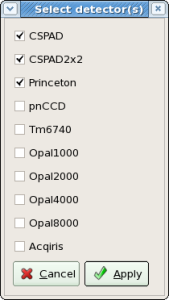
and the title of the Detector button shows how many detectors are selected. For File Manager tool only one detector should be selected.
Parameters of this panel must be set before any other actions with Calibration Manager.
Logbook panel
Logbook panel is located in the bottom of the main window. It is intended as a global information panel in order to minimize a number of specific information fields. Records and messages at variation of status or at clicks on information buttons are posted in this panel. At the end of each session content of this panel is saved under work directory in the log-file with name containing start session time stamp.
Status panel
Status panel shows up in a few applications such as Dark, File Manager, etc. on the top of application space. In most cases it shows content of the calibration directory for specified list of detectors. For each calibration file its effective run range is shown next right to its name. The effective run range is presented by two numbers, begin run and end run of the range. Run ranges may overlap for different files. If this happens, files from bottom side have higher priority.
Tab-bar for tool selection
Tab-bar allows to switch between different applications. Completely implemented applications under tabs:
Dark
Dark run processing tool is intended to produce calibration files for pedestals (for dark level subtraction) from dark runs and deploy them in correct place in calibration directory. In parallel hot pixel masks are produced and can be also deployed.
Dark panel is activated at click on Dark tab. It consists of
Control bar contains
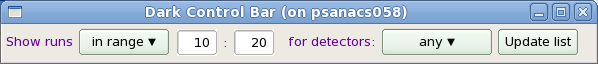
- buttons for list of runs filter by the run type and detector type and
- check box for deployment of the hot pixel mask in parallel with averaged dark
List of run items panel consists of records for each run in "regular" - short or "expert" - extended mode.
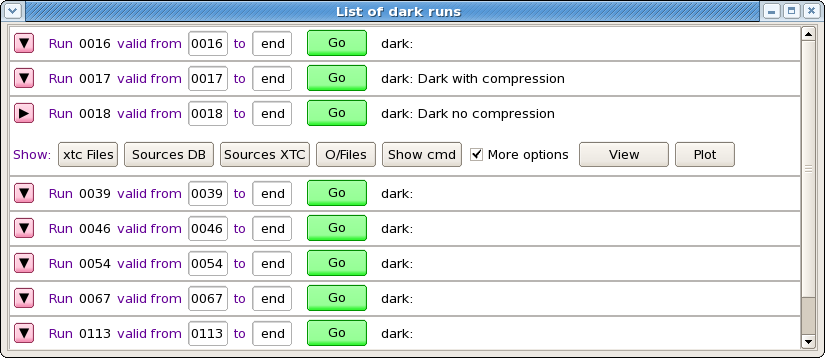
Each run item in "regular" mode contains

- button with triangle sign to switch between "regular" and "expert" mode of the run item,
- run number
- two fields to set run validity range for output calibration file
- button Go - submits job in batch for evaluation of pedestals and hot pixel mask
- button Deploy - shows up when butch job is completed successfully and all files for deployment are available
Expert mode contains more information buttons for each run item
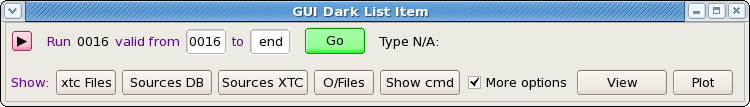
- xtc Files - prints in the Log book panel the list of available xtc files,
- Sources DB - prints in the Log book panel the list of available data sources found in DB,
- Sources XTC - prints in the Log book panel the list of available data sources found at the xtc file scan,
- O/Files - prints in the Log book panel the list of files associated with dark run processing and their current status,
- Show cmd - prints in the Log book panel the list of deployment commands, and
- More options check box - if it is marked then more buttons show up:
- View - launch text-file viewer and
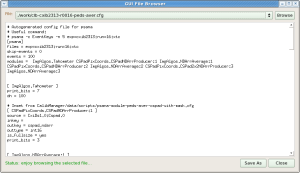
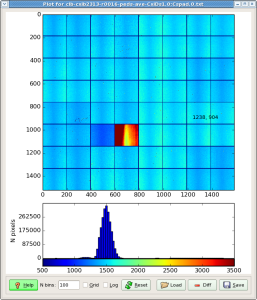
- Plot - plots image from selected from pop-up menu file. In case of files containing CSPAD array with shape=[32*185,388] image is currently generated as a table for all sensors:
ROI
Application panel under ROI (Region Of Interest) tab controlls re-implemented algorithms of the command line roicon, described in Make ndarray for ROI mask.
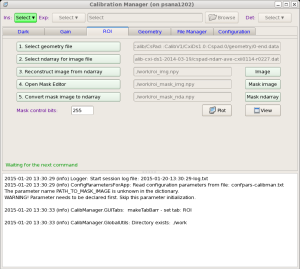
The files with ndarray and geometry constants should be selected as input parameters in the first two options of this GUI. The names of other intermediate and output files for "Image", "Mask image", and "Mask ndarray" are optional. Next three buttons
- 3. reconstruct image from ndarray,
- 4. Open Mask Editor, and
- 5. Convert mask image to ndarray
executes associated procedures. "Mask control bits" parameter controls sensor pixels, which will to be masked. For example, for CSPAD
- Mask control bits = 0 - do not mask sensor pixels
- +1-mask edges,
- +2-wide pixels,
- +4-non-bounded pixels,
- +8-non-bounded pixel neighbours.
When launched, Mask Editor works as completely independent application. The Mask Editor allows to draw on image any number of a few geometry figure types and finally generate and save positive or negative mask for loaded image. When mask is created it needs to be saved in the "Mask image" file. After that mask editor can be closed.

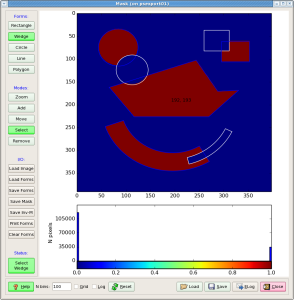
All files and images of the ROI application can be "Plot"-ted and "View"-ed. For now, mask file is saved in the work directory and is not deployed. In stead, its path could be used in the ImgAlgos.NDArrCalib module.
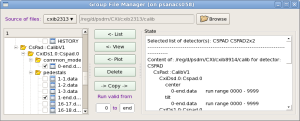
Single File Manager
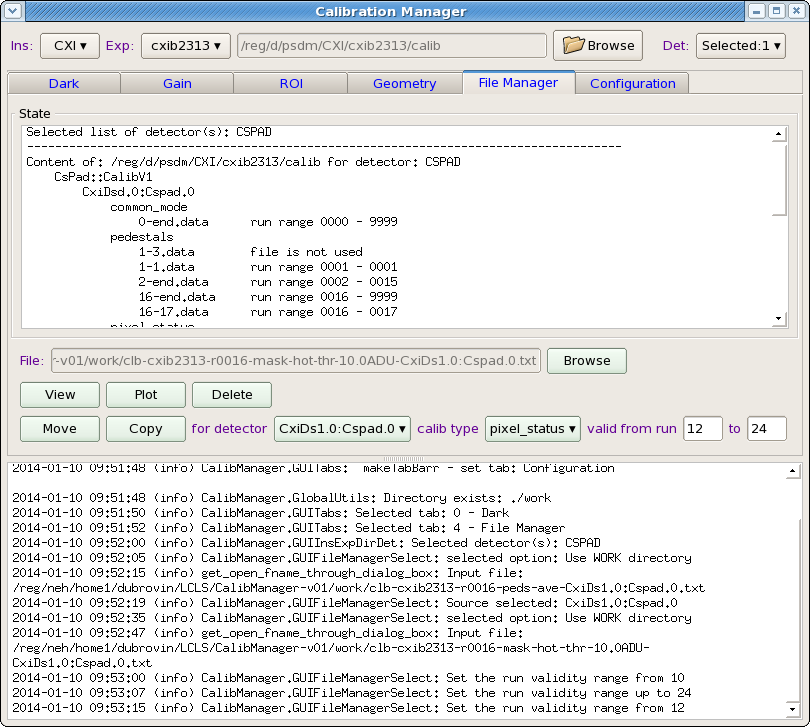
File manager tool consists of Status panel and control panel:
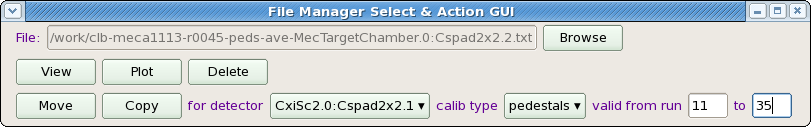
File manager control panel contains a set of control fields with functionality as follows.
- Button Browse - launches the file selection window which helps to select any calibration file in any location. Location is hinted in the intermediate pop-up window. Selected file is displayed in the next-left information field.
- View button - opens/closes the file viewer in separate window.
- Plot buttons - opens/closes the plotter window and plots the file as 2-d image (if applicable).
- Delete button - deletes the selected file from disc.
- Move/Copy buttons - perform associated actions on selected file. The destination directory and file name is defined by the Instrument/Experiment/Detector selection panel and next-right filelds:
- for detector selection button - sets the destination detector name from drop down menu,
- calibration type selection button - sets the destination calibration type, and
- two editable fields - set the run range for destination calibrationfile.
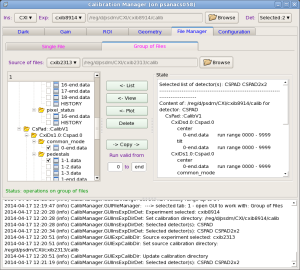
Group File Manager
Geometry
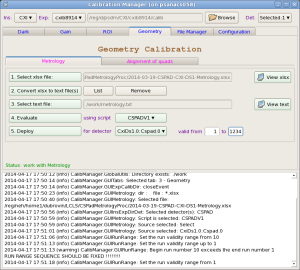
Metrology
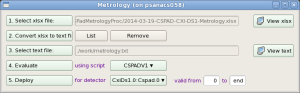
Metrology tool processes xlsx files from opitcal measurements, produces calibration constants of types geometry, center and tilt, and deploy them in calibration directory.
xlsx files are human-made, so, one has to be careful and check that the text file, produced in auto-conversion by command #2 has correct format.
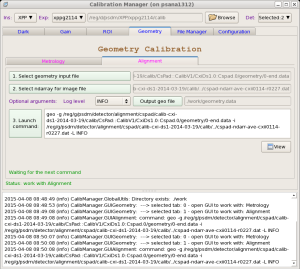
Alignment
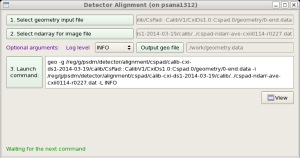
Alignment tool works with geometry files, produced in Metrology tool and allows to tune quad or other sensor positions in the detector, using image with real objects (rings, shadows, etc).
More details about this tool can be found in Detector Alignment Tool.
Configuration
Configuration tool has its own tab bar switching between panels with sets of parameters.
Two panels are implemented currently:
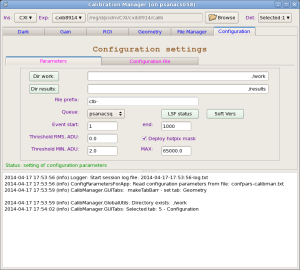
Configuration Parameters

This panel has a few active fields:
- Dir work button - launch directory selection window for
workdirectory. Selected directory shows up in the next right information field. - Dir results button - launch directory selection window for
resultsdirectory. Selected directory shows up in the next right information field. This directory is not currently in use. - File prefix editable field - sets common prefix of all files created in the work directory, excluding the log file.
- Queue combo box - sets the queue name for batch jobs from available list containing psnehq, psfehq, etc.
- Event start/end editable fields - set the first and last event in current run for calibration processing job.
- Threshold, ADU editable field - sets the threshold on RMS in ADU (Analog to Digit Units) for hot pixel mask. If RMS for pixel exceeds this threshold - pixel is marked as hot in the hot pixel mask file. "Zero" is a special value, indicating that no pixels will be flagged as hot pixels because of noise.
- Threshold MIN/MAX editable fields - if a pixel's pedestal is outside the MIN/MAX range it will be flagged in the hot pixel mask file.
- Deploy hotpix mask check box - if checked - hotpixel mask file will be deployed along with pedestal file at click on Deploy button in the List of run items.
Configuration File
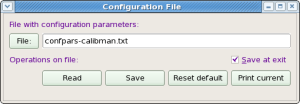
This panel is intended for manipulation with configuration file, which contains a list of configuration parameters for entire project. The panel has a few active fields:
- File button and next right editable field - allows to select/type-in the configuration file name.
- Read, Save, Reset default buttons - perform associated operations on parameters at click.
- Print current - dumps current list of configuration parameters in the Log-book panel.
Confirmation windows
There is a bunch of confirmation popup windows with modal-style dialog. Appropriate selection need to be done by clicking on possible continuation buttons.
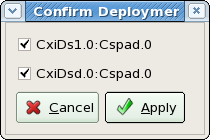
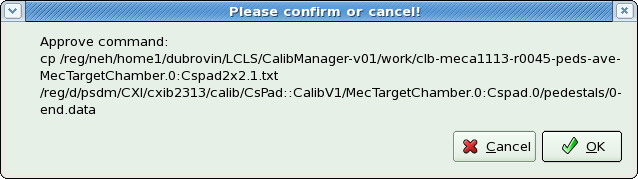
Modal dialog assumes that one of the buttons in this type of dialog window need to be clicked, otherwise UI will be frozen.
Project status
2015-04-08 status corresponds to:
relinfo
Pkg/Rel        TEST   BASE(ana-0.13.18)
CalibManager   HEAD   V00-00-83
ImgAlgos       HEAD   V00-03-80
PSCalib        HEAD   V00-02-33
PSQt           HEAD   -
Completely implemented applications under calibman tabs:
- Dark
- ROI
- File Manager
- Single File Manager
- Group File Manager
- Configuration
- Geometry
- Metrology - implemented for CSPAD CXI-V1, XPP-V2, CSPAD2x2
- Alignment
calibrun - command-line application is fully functional
Recommended updates
On 2015-04-15: ana-current (a.k.a. ana-0.14.01) does not need in updates.
How to get and run calibman
Run application in current release
If there is no known recent changes in the code of the project, then it may be launched using current release (≥ ana-0.10.10) from any directory :
cd <your-favorite-directory>;
sit_setup ana-current;
calibman;
Get latest version, compile, and run
The latest version of this application with recent modifications for packages can be created and executed from the local release directory. Login to psana, then run use commands with appropriate substitutions for <...> fields:
cd <your-favorite-directory>;
newrel ana-current rel-calibmanager;
cd rel-calibmanager;
sit_setup <release-tag>;
addpkg CalibManager HEAD;
addpkg <package2> HEAD;
addpkg <package3> HEAD;
...
scons;
calibman;
First session
No matter what tool tab is opening by default in the first session, it would be better to make sure that configuration parameters are set correctly. To do that click on tab Configuration, which opens Configuration Settings panel, then click on tab Parameters. Most parameters can be used with default values, but it is important to check, that
correct queue will be used for batch jobs. If necessary, change Queue in combo box.
correct range of events is set for event processing.
Threshold on rms is good for calibrated detector(s). Evaluation of this threshold requires in simple analysis which can be done after the 1st iteration on event averaging. Files containing averaged intensities and their rms values can be plotted as image and spectra. Spectrum of rms gives a rough idea of how to set this threshold. When threshold is set, second iteration on event averaging will produce correct mask-file for hot pixels, which rms exceeds the threshold.
How to calibrate / deploy files for dark correction
- Click on tab Dark.
- Set Instrument, Experiment, from combo boxes and click on Select button to select Detector(s) from pop-up window.
- Set filter for runs using combo boxes to the right from labels Show runs and for detectors.
- For runs in the table, which you want to calibrate, click on button Go, relax and wait until button Deploy show-up to the right from button. A few buttons Go can be clicked sequentially for different runs in order to run appropriate jobs in batch simultaneously.
- Change validity range if necessary, click on Deploy button. If everything is ok, it is done!
Known problems and ways around
World is not perfect. Anything may happen during this long workflow. Expert mode sheds light on most of the problems. Here is a list of most frequent problems;
- AFS token is expired for your terminal session. Batch system will complain. Before launching
calibmanapplication, first executekinitandaklogcommands. - job on data from NEH/FEH are submitted to the wrong butch queue psfehq/psnehq. Set appropriate queue.
- DB has a list of sources (detectors) which does not coincide with what is written in xtc file. After job is submitted, check the list of detectors found in xtc scan and check only available detectors in the Detector selection menu.
Command line interface
Available since release ana-0.10.16.
Command line interface for dark-run calibration of detectors is implemented by P.O.C.s request. It can be started by the command calibrun with parameters. The list of parameters can be dumped on terminal by the command:
calibrun -h
which prints
Usage:   calibrun [options] args
Example: calibrun -e xppi0613 -d CSPAD,OPAL1000 -c ./calib -P -D -r 173

calibrun - command line calibration utility

Options:
  -h, --help            show this help message and exit
  -e EXP, --exp=EXP     experiment name, ex.: cxi12345
  -r RUNNUM, --run=RUNNUM
                        run number
  -n NUM_EVENTS, --num_events=NUM_EVENTS
                        number of events to process
  -s SKIP_EVENTS, --skip_events=SKIP_EVENTS
                        number of events to skip before processing
  -m SCAN_EVENTS, --scan_events=SCAN_EVENTS
                        number of events to scan data and search for selected
                        detector(s)
  -f EVENT_CODE, --event_code=EVENT_CODE
                        event code for dark event selection
  -t THR_RMS, --thr_rms=THR_RMS
                        threshold on rms for hot pixel mask evaluation
  -v RUNRANGE, --runrange=RUNRANGE
                        validity run range, ex.: 123-567 or 123-end
  -q QUEUE, --queue=QUEUE
                        queue name, ex: psnehq, psfehq, psanacsq. If specified
                        - run in batch
  -w WORKDIR, --workdir=WORKDIR
                        work directory, ex: ./work
  -c CALIBDIR, --calibdir=CALIBDIR
                        non-standard calibration directory, ex: ./calib
  -x XTCDIR, --xtcdir=XTCDIR
                        non-standard path to xtc directory(<INS>/<EXP>/xtc are
                        required), ex: .mydir/xpp/xppi0613/xtc, or
                        /reg/d/ffb/cxi/cxi12345/xtc
  -d DETECTOR, --detector=DETECTOR
                        detector names separated by comma,
                        ex:CSPAD,CSPAD2x2,PNCCD
  -p PRINT_BITS, --print_bits=PRINT_BITS
                        0-print nothing, +1-debug, +2-info, +4-warning,
                        +8-error, +16-critical; default=036, minimal
                        recommended=020
  -P, --process         process xtc files and produce calib files under the
                        "work" directory
  -D, --deploy          deploy calibrated files under the "calib" directory
  -L, --loadcfg         load and use configuration parameters from file after
                        "calibman"
The calibrun application reuses code and approach developed for calibman. At start calibrun loads parameters from configuration file confpars-calibman.txt. By default this file is the same configuration file as for calibman. If parameters were already set in confpars-calibman.txt, then calibrun can be started with a single parameter - run number (-r <run-number>) and options for processing (-P) and deployment (-D), for example:
calibrun -r <run-number> -P -D
otherwise, desired parameters need to be defined in the command line. If parameters are not defined either in the command line or in the configuration file, then application will dump to terminal hint-warnings about missing option(s) which needs to be added to the command line in order to complete job. An example of the command with minimal set of self-sufficient parameters should looks like
calibrun -e xppi0613 -d CSPAD,OPAL1000 -P -D -r 173
This command will process (-P) xtc files for experiment (-e) xppi0613, run (-r) 173, detectors (-d) CSPAD and (,) OPAL1000, and deploy (-D) them for default run range 173-end under the default calib directory /reg/d/psdm/xpp/xppi0613/calib/
By default the image-averaging psana job is processed interactively. If queue (-q <queue-name>) option is provided, it is submitted in batch.
By default the calibrun command produces quite extensive output on terminal which in most cases is sufficient to figure out what is going on. If the print-control option (-p 0) is provided, the major output will be suppressed and only begin, end of job comments, and warning messages will be printed. Most complete output can be found in the session log file auto-saved in the work directory with relevant time stamp in the name, for example: ./work/2014-04-16-16:43:52-log.txt
GUI-based calibration manager calibman has the same file name conventions and can always be used to inspect all output files and problems generated by the command line application calibrun.
How to run on ffb data
Command calibrun can work on ffb data using option -x <path-to-xtc>. This option sets non-standard path to xtc files. For example:
calibrun <options> -x /reg/d/ffb/cxi/cxi12345/xtc <more-options>
The "live" mode is turning on automatically if the directory path has "ffb" sub-folder.
References
Overview
Content Tools