Content
Motivation
Composite detectors, consisting of many sensors need in alignment. As it is mentioned in CSPAD Alignment optical measurements set sensor positions in quads, but relative quad positions need to be aligned using images. This tool allows to manipulate with geometry parameters (see Detector Geometry) and have a visual control on variation of image. This approach allows to set detector component positions with precision about pixel size.
Alignment tool components
Main control window
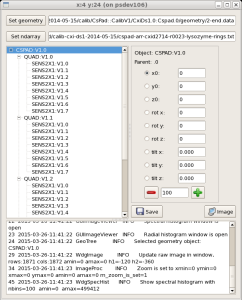
Main control window has a few panels to interact with this application;
- file name for geometry parameters,
- file name for ndarray with image,
- select geometry object component which needs to be aligned (translated and rotated),
- select the parameter which is going to be changed,
- set the step value for parameter variation,
- change the parameter clicking on "+" or "-" buttons,
- save the modified geometry in the file,
- messaging panel.
Image viewer
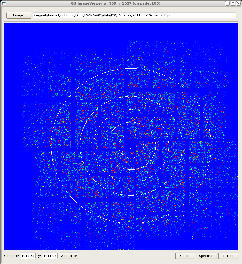
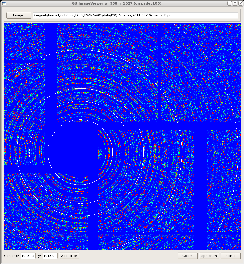
Image viewer shows detector image reconstructed from the file with ndarray using current geometry parameters. It has a few convenience features:
- zoom-in - click on left mouse button, hold it and drag in order to select the rectangular portion of the image to zoom-in.
- zoom-out - click on middle mouse button in order to zoom-out image to its original size.
- Add circle button adds circles with random radius to the image. All circles have common center. Click on middle mouse button around circle deletes circle
- The center position and circle radius can be changed by click and drag left/right mouse button.
- Buttons Colors, Spectrum, and r-Histo serve to open/close satellite windows described below.
Spectral histogram
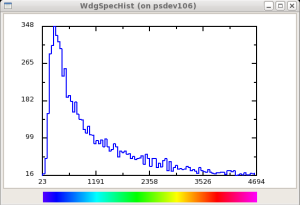
Spectral histogram shows current (zoomed) image intensity distribution in ADU units and its association with colors. It has a few interactive features:
- left/right mouse button click selects the minimal/maximal value to re-generate the image colors and spectrum itself.
- middle mouse button click reset the original scale.
- spectrum is re-generated in case if image is updated or zoom rect is changing.
Radial histogram
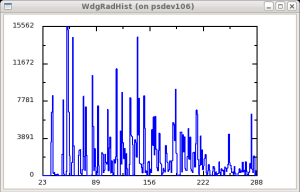
Radial histogram shows angular-integrated per-pixel-normalized intensity distribution in radial direction co current (zoomed) image and center position. This histogram is updated when image is changed, zoomed, or center position is changed.
Color table selection widget
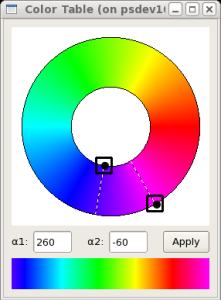
Color table selection widget allows to change the color table for image. Two Hue angles set the limits for color table. These parameters can be controlled by the mouse or edit in two fields. Apply button sends a signal to update color table on image and spectrum.
Run latest version
Hint on input parameters can bee seen by command:
geo -h
...
Usage: geo [-g <geo-fname>] [-i <image-array-fname>] [-L <logger-level>] [-h] [<test-number>]
where optional arguments
-g <geo-fname>- file name with geometry parameters,-i <image-array-fname>- file name with image ndarray,-L <logger-level>- verbosity level, which can beDEBUG, INFO, WARNING, CRITICAL, ERROR,orNONE,-h- show help on input parameters,
and non-optional argument <test-number> is used for debugging purpose.
The ndarray image file must be an unassembled image file (i.e. 3D array with no geometry applied). Sample psana code to save this ndarray image file:
calib = det.calib(evt)
det.save_txtnda(fname='unassembled.txt',ndarr=calib,fmt="%.5f")
Application can be launched without parameters by the command
geo
Launch application from Calibration Manager
This option is available since release ana-0.13.19.
Application geo can be launched from the Calibration Management Tool (command calibman) under tabs Geometry -> Alignment. The calibman GUI helps to define all optional geo command-line parameters, which alternatively can be defined from application control GUI.
References
Overview
Content Tools