Page History
Policies
LCLS users are responsible for complying with the data management and curation policies of their home institutions and funding agents and authorities. To enhance the scientific productivity of the LCLS user community, LCLS supplies on-site disk, tape and compute resources for prompt analysis of LCLS data, and software to access those resources consistent with the published data retention policy. Compute resources are preferentially allocated to recent and running experiments.
Data Management
Please be aware that the system administration team reserves the right for computer system maintenance on the 1st Wednesday of each month. Computers and storage systems might experience short and announced outages during these days.
- The Electronic Logbook
Getting help
The first line of help is available by sending email to pcdshelp@slac.stanford.edu.
If you have problems with a specific piece of the analysis software, please have a look at our bug-tracking system https://pswww.slac.stanford.edu/trac/psdm.
In case of an emergency that affect your data taking ability, please ask the instrument scientist or the floor coordinator. They have a contact list with all the people in the PCDS group.
Getting access to the system
Printing
The following printers are available in the NEH building from all the UNIX nodes:
Info | Location | Device URI |
|---|---|---|
Dell 3130 | AMO Control Room | lpd://dellcolor-neh-amo1/lp |
Dell 3130 | AMO Control Room | lpd://dellcolor-neh-amo2/lp |
Dell 3130 | SXR Control Room | lpd://dellcolor-neh-sxr1/lp |
Dell 3130 | SXR Control Room | lpd://dellcolor-neh-sxr2/lp |
Dell 3130 | XPP Control Room | lpd://dellcolor-neh-xpp1/lp |
Dell 3130 | XPP Control Room | lpd://dellcolor-neh-xpp2/lp |
HP Color LaserJet CP3525 | Bldg 950 corridor ground floor | ipp://hpcolor-neh-corridor/ipp/ |
Xerox WorkCentre 5675 | Bldg 950 Rm 218, Jason Alpers | ipp://hpcolor-neh-laser/ipp/ |
HP Color LaserJet 4700 | Bldg 950 Rm 204, Ray Rodriguez | ipp://hpcolor-neh-ray/ipp/ |
HP LaserJet 4350 | Bldg 950 Rm 203 | ipp://hpcolor-neh-srvroom/ipp/ |
Running analysis on the science data
Interactive farm
Each instrument has 2 (two) interactive compute systems for users to login and perform analysis computing:
- AMO:
psanaamo01andpsanaamo02 - SXR:
psanasxr01andpsanasxr02 - XPP:
psanaxpp01andpsanaxpp02
If you have larger amounts of compute jobs that might run for a long time, please use our batch queueing system LSF.
Using the LSF batch system
Login to psdev or pslogin (from SLAC) or psimport or psexport (from anywhere). From here you can submit a job with the following command:
bsub -q lclsq -o <output file name> <job_script_command>
For example:
bsub -q lclsq -o ~/output/job.out my_program
This will submit a job (my_program) to the queue lclsq and write it's output to a file named ~/output/job.out.
You may check on the status of your jobs using the bjobs command.
For a more detailed description and more more LSF commands, please see
http://www.slac.stanford.edu/comp/unix/unix-hpc.html
Storage for experimental data
LCLS provides space for all your experiment's data at no cost for you. This includes the measurements raw data from the detectors as well as the data derived data from your analysis software. Your raw data are available as XTC files or, on demand, as HDF5 files.
Short-term storage
All your data is available on disk for one year after data taking. The path name is /reg/d/psdm. The data files are currently stored in a Lustre file system.
Long-term storage
After one year, your data files are removed from disk. The data files remain stored on tape at the silos in the SLAC computing division building for up to 10 years. LCLS may restore your data from tape back to disk for you to access. Restoring the data to disk more than once will require the approval of the LCLS management.
Data access and export
There is a web interface to the experimental data accessible via https://pswww.slac.stanford.edu/apps/explorer/
The web interface also allows you to generate file lists that can be fed into bbcp to export your data from SLAC to your home institution. You can use psexport or psimport for moving your data.
The tools for managing files are described here.
Running the Analysis
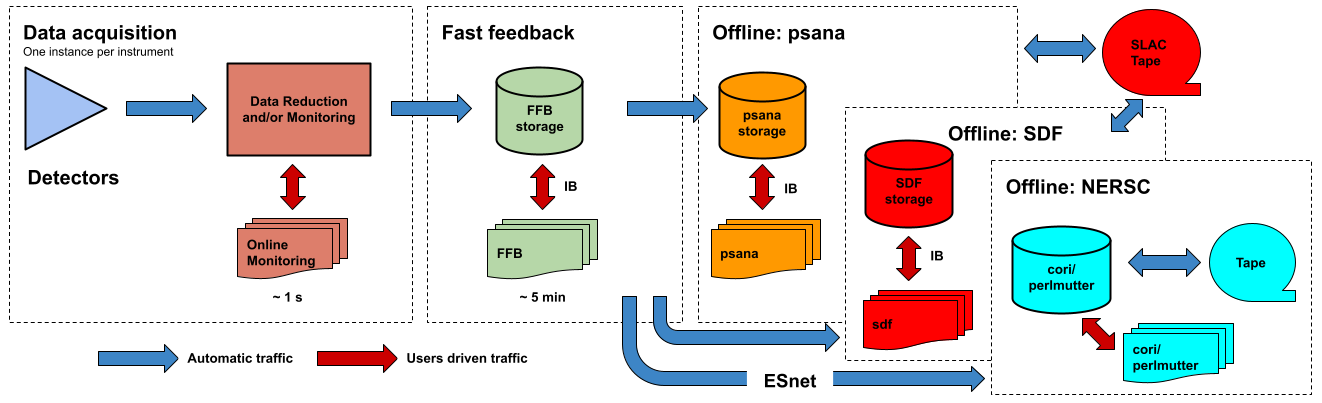
The analysis framework is documented in the Data Analysis page for the LCLS-I/HXR systems and psana for the LCLS-II (SXR&UED) systems. This section describes the resources available for running the analysis. The following figure shows a logic diagram of the LCLS data flow and indicates the different stages where data analysis can be performed in LCLS:
- Data acquisition - The online monitoring nodes get detector data over the network and place it in shared memory on each node. There is a set of monitoring nodes allocated for each instrument. The detector data are received over the network by snooping the multicast traffic between the DAQ readout nodes and the data cache layer. Analysis performed at this stage provides < 1 s feedback capabilities. The methods for doing (quasi) real time analysis are described in the Prompt Analysis page. Users should be aware of the different possibilities and choose the approach that works best for their experiment.
- Fast feedback - The processing nodes in the FFB system read the detector data from a dedicated, flash-based file system. It is possible to read the data as they are written to the FFB storage layer by the DAQ without waiting for the run to end. Analysis performed at this stage provides < 5 min feedback capabilities. The resources reserved for this stage are described in the Fast Feedback System page.
- Offline - The offline nodes read the detector data from disk. These systems include both interactive nodes and batch queues and are the main resource for doing data analysis. We currently support sending the data to three offline systems: psana, S3DF and NERSC. The psana system is the default offline system and your data will end up in psana unless you arrange a different destination with your experiment POC. The psana system is also relatively old and it will be retired when more storage becomes available in the S3DF system. Please consider running at NERSC if you expect to have intensive computing requirements (> 1 PFLOPS).
 See the DataExportation page for more information.
Overview
Content Tools