Page History
Policies
LCLS users are responsible for complying with the data management and curation policies of their home institutions and funding agents and authorities. To enhance the scientific productivity of the LCLS user community, LCLS supplies on-site disk, tape and compute resources for prompt analysis of LCLS data, and software to access those resources consistent with the published data retention policy. Compute resources are preferentially allocated to recent and running experiments.
Getting an Account
You will need a valid SLAC UNIX account in order to use the LCLS computing system. The instructions for getting a SLAC UNIX account are here.
Getting Access to the System
You can get into the LCLS photon computing system by ssh'ing to:
| No Format |
|---|
pslogin.slac.stanford.edu
|
From the pslogin pool you can then reach the analysis nodes (see below).
You can also consider connecting to the LCLS system using NX technology: this approach allows to preserve the status of a connection across multiple sessions and it provides better performance for displaying remote graphics.
Each control room has a number of nodes for local login. These nodes have access to the Internet and are named psusr<id>.
The controls and DAQ nodes used for operating an instrument work in kiosk mode so you don't need a personal account to run an experiment from the control room. Remote access to these nodes is not allowed for normal users.
Data Management
LCLS provides space for all your experiment's data at no cost for you. This includes the raw data from the detectors as well as the data derived from your analysis. Your raw data are available as XTC files or, on demand, as HDF5 files. The path to the experimental data is:
| No Format |
|---|
/reg/d/psdm/<instrument>/<experiment>
|
The LCLS data policy is described here. The tools for managing files are described here.
...
You can use the psexport pool for copying your data:
| No Format |
|---|
psexport.slac.stanford.edu
|
The recommended tools for exporting the data offsite are bbcp and Globus. The former, bbcp, is slightly simpler to setup. On the other hand Globus is more efficient when transferring large amount of data because it babysits the overall process by, for example, automatically restarting a failed or stalled transfer. The performance of the two tools is very similar.
All control rooms and the overflow room in FEH have one or more taps on the Visitor Data Network. These taps can be used to transfer data to a laptop or a storage device. These devices will be automatically assigned an IP address through DHCP as soon as they are connected to the network tap.
Running the Analysis
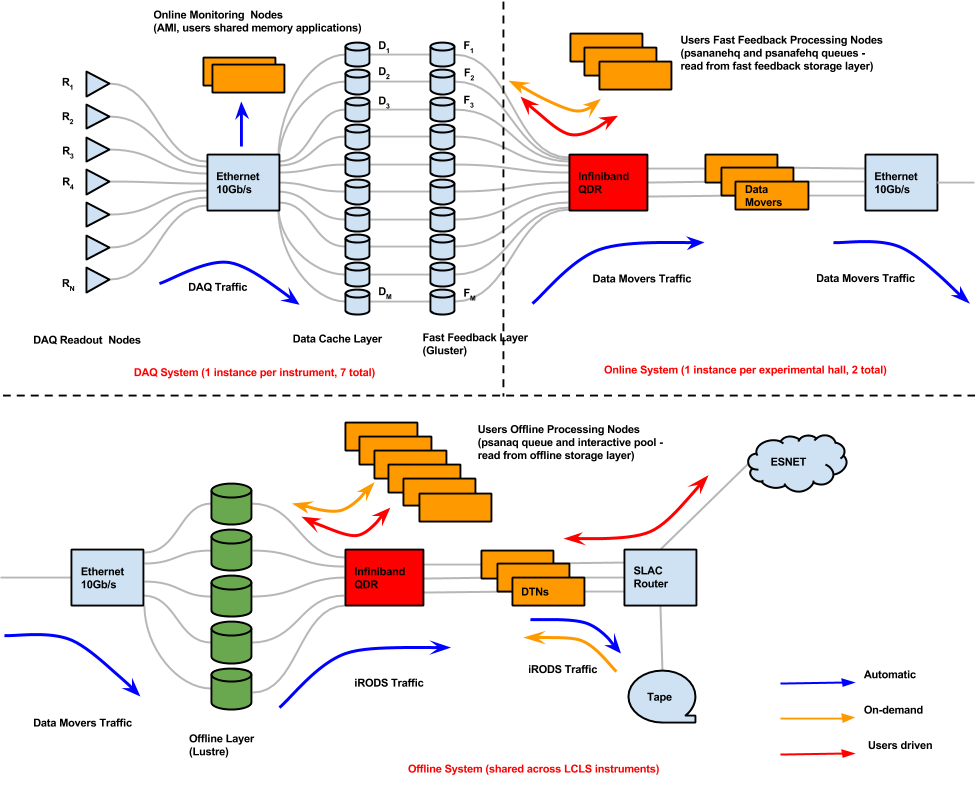
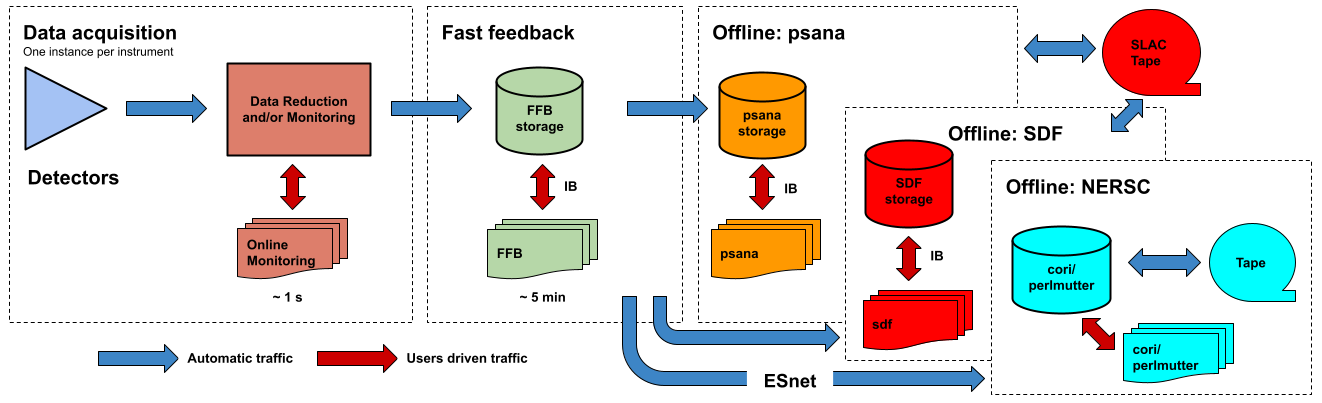
The analysis framework is documented in the Data Analysis page for the LCLS-I/HXR systems and psana for the LCLS-II (SXR&UED) systems. This section describes the resources available for running the analysis. The The following figure shows a logic diagram of the LCLS data flow and indicates the different stages where data analysis can be performed in LCLS:
- Online monitoring nodesData acquisition - These The online monitoring nodes get detector data over the network and place it in shared memory on each node. The There is a set of monitoring nodes allocated for each instrument. The detector data are received over the network by snooping the multicast traffic between the DAQ readout nodes and the data cache layer. There is a set of monitoring nodes allocated for each instrument.. Analysis performed at this stage provides < 1 s feedback capabilities. The methods for doing (quasi) real time analysis are described in the Prompt Analysis page. Users should be aware of the different possibilities and choose the approach that works best for their experiment.
- Fast feedback - The processing nodes in the FFB system Fast feedback nodes - These nodes read the detector data from dedicated disks that each experimental hutch hasa dedicated, flash-based file system. It is possible to read the data in quasi-real time as they are written to the fast feedback ( FFB ) storage layer by the DAQ without waiting for the run to end. There is one farm of FFB nodes for each experimental hall. Analysis performed at this stage provides < 5 min feedback capabilities. The resources reserved for this stage are described in the Fast Feedback System page.
- Offline nodes - These The offline nodes read the detector data from disk. These nodes systems include both interactive nodes (psana pool) and batch farms (psanaq queue, see below). These nodes queues and are the main resource for doing data analysis and are shared across all LCLS instruments.
Interactive Pool
In order to get access to the interactive nodes, connect to psana:
| No Format |
|---|
ssh psana
|
The psana pool is currently made of 16 servers with the following specifications:
- 12-cores, Xeon E5-2620 v3 2.4GHz, 128GB memory, 10Gb/s, no IB
LCLS provides a few Matlab licenses and one IDL license. Instructions on how to use these tools are in the Matlab and IDL pages.
Each psana interactive nodes has a GPU accelerator.
Batch Farms
There are a number of batch farms (i.e. collections of compute nodes) located in the central computing building and in the NEH and FEH experimental halls. Instructions describing how to submit jobs can be found on the Submitting Batch Job page.
The main batch farm currently consist of 80 nodes with the following general specifications:
- 12 cores, Xeon X5675, 24GB memory, QDR IB
In addition, each experimental hall provides 20 nodes with access to the fast feedback storage layer (FFB). These nodes provide the resources for the high priority queues for the running experiments and have the following specifications:
- 16 cores, Xeon E5-2640 v3, 128GB memory, QDR IB
Remote Visualization
When performing analysis on the psana interactive nodes, it is useful to display plots on your host machine. For host machines near SLAC, using ssh with X-windows forwarding (the -X or -Y options) suffices. X windows forwarding can get slow for host machines in Europe. Some users have found better performance with technology called nomachine, this is documented on the Remote Visualization page.
Prompt Analysis
- . We currently support sending the data to three offline systems: psana, S3DF and NERSC. The psana system is the default offline system and your data will end up in psana unless you arrange a different destination with your experiment POC. The psana system is also relatively old and it will be retired when more storage becomes available in the S3DF system. Please consider running at NERSC if you expect to have intensive computing requirements (> 1 PFLOPS).
 There are various ways to get real time information about the data acquired by an LCLS experiment. Users should be aware of the different possibilities and choose the approach that works best for their experiment. The methods for doing prompt analysis are described here.
Overview
Content Tools