Why do I think that 2020-02-25 optical metrology is good
- metrology was done on 2020-02-25 for new detector which currently labeled on connectors side as ePix10k2M 1, also known as epix10ka2m.1, 2M.1 etc.
- very good quality check
- all z-measurements are around 1 feet, have a lot of repeatable numbers - can't be trusted
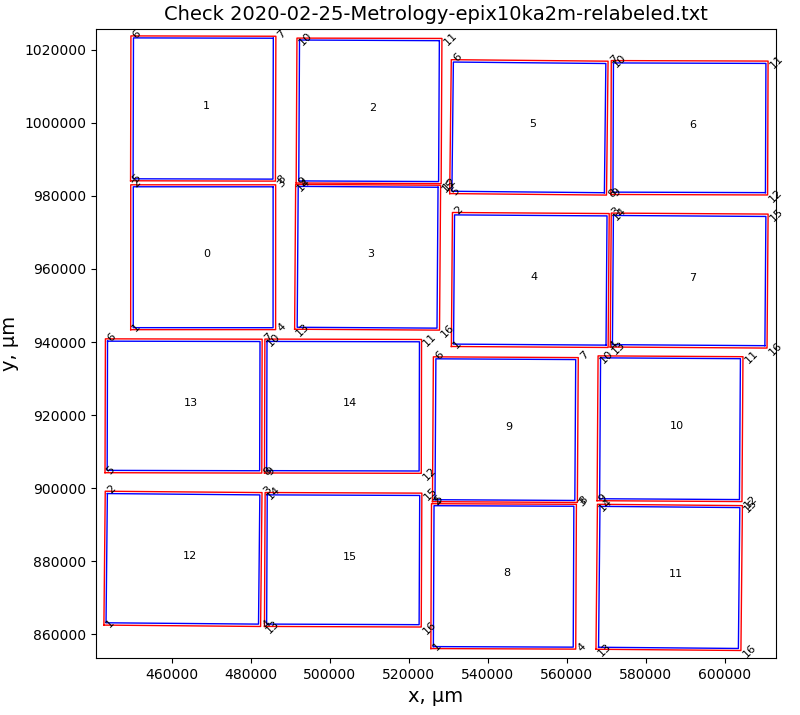
Quality check for original optical metrology from 2020-02-25
X-Y quality check for optical metrology measurements
----------------------------------------------------------------------------------------------------------------------------
segm:        S1      S2     dS1     dS2        L1      L2     dL1     dL2    angle(deg)   D1      D2      dD   d(dS)   d(dL)
----------------------------------------------------------------------------------------------------------------------------
segm: 0   36697   36688      18       9     39685   39676       9       0   -0.01949   54057   54032      24       9       9
segm: 1   36672   36696      90     114     39690   39688     -93     -95   -0.14725   54046   54045       0     -24       2
segm: 2   36703   36700     202     199     39695   39782    -183     -96   -0.28908   54127   54060      67       3     -87
segm: 3   36683   36700     260     277     39677   39695    -243    -225   -0.38763   54060   54039      20     -17     -18
segm: 4   36710   36693    -274    -291     39685   39687     270     272   -0.40785   54063   54049      14      17      -2
segm: 5   36686   36679    -408    -415     39699   39688     406     395   -0.59396   54065   54036      29       7      11
segm: 6   36684   36676    -134    -142     39693   39693     115     115   -0.19920   54036   54055     -18       8       0
segm: 7   36696   36705    -287    -278     39693   39706     256     269   -0.40771   54066   54064       1      -9     -13
segm: 8   36675   36684     162     171     39688   39674    -146    -160   -0.24041   54037   54036       1      -9      14
segm: 9   36679   36678     232     231     39671   39683    -220    -208   -0.33429   54034   54034       0       1     -12
segm:10   36679   36682     253     256     39677   39694    -240    -223   -0.36743   54044   54039       5      -3     -17
segm:11   36693   36701     367     375     39714   39690    -343    -367   -0.53539   54057   54075     -17      -8      24
segm:12   36677   36682    -378    -373     39671   39686     340     355   -0.54221   54038   54037       0      -5     -15
segm:13   36670   36681    -108     -97     39685   39679      98      92   -0.14800   54035   54034       0     -11       6
segm:14   36683   36671     -96    -108     39693   39664     104      75   -0.14729   54029   54036      -7      12      29
segm:15   36686   36677    -163    -172     39690   39677     169     156   -0.24184   54046   54034      11       9      13
----------------------------------------------------------------------------------------------------------------------------
  WARNING segm  2:  |67| > 60.0
  WARNING segm  2:  |-87| > 60.0
Optical metrology processed by script v0 (with quads) and v1 (without quads)
- red rectangles - for points measured in optical metrology
- blue rectangles - panels reconstructed from geometry file

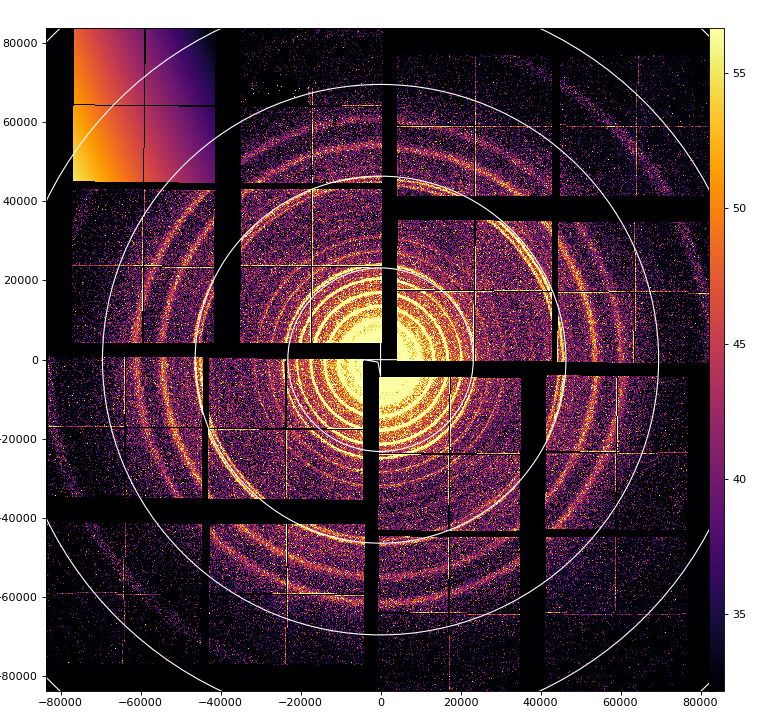
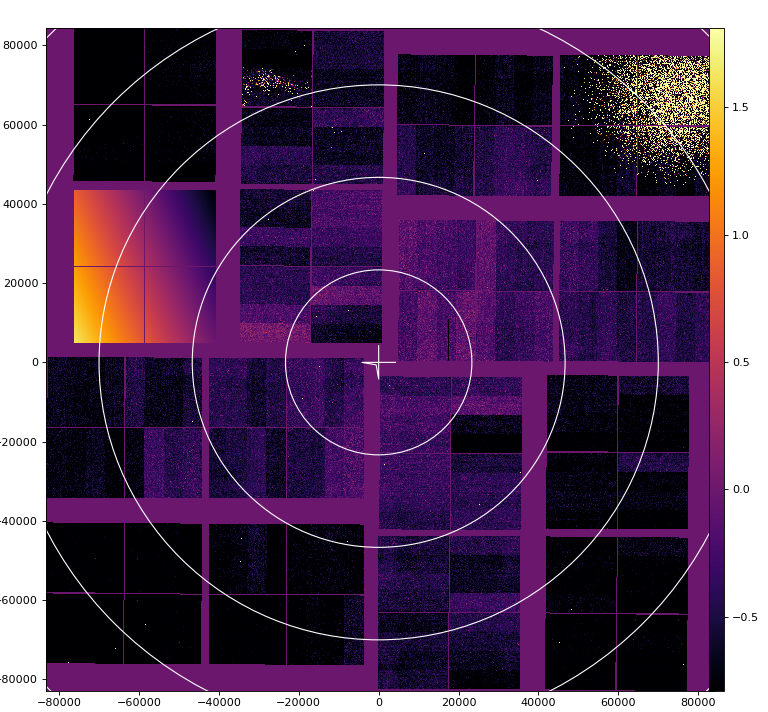
DAQ panel indexes in optical metrology possible detector orientations
DAQ panel indexes in optical metrology possible orientations
        rot = 0  ^y
        Q0  1  3 |  4  5  Q1
            0  2 |  6  7
        ---------+----------> x
           15 14 | 10  8
        Q3 13 12 | 11  9  Q2

        rot = 1  ^y
        Q3 13 15 |  0  1  Q0
           12 14 |  2  3
        ---------+----------> x
           11 10 |  6  4
        Q2  9  8 |  7  5  Q1

        rot = 2  ^y
        Q2  9 11 | 12 13  Q3
            8 10 | 14 15
        ---------+----------> x
            7  6 |  2  0
        Q1  5  4 |  3  1  Q0

        rot = 3  ^y
        Q1  5  7 |  8  9  Q2
            4  6 | 10 11
        ---------+----------> x
            3  2 | 14 12
        Q0  1  0 | 15 13  Q3
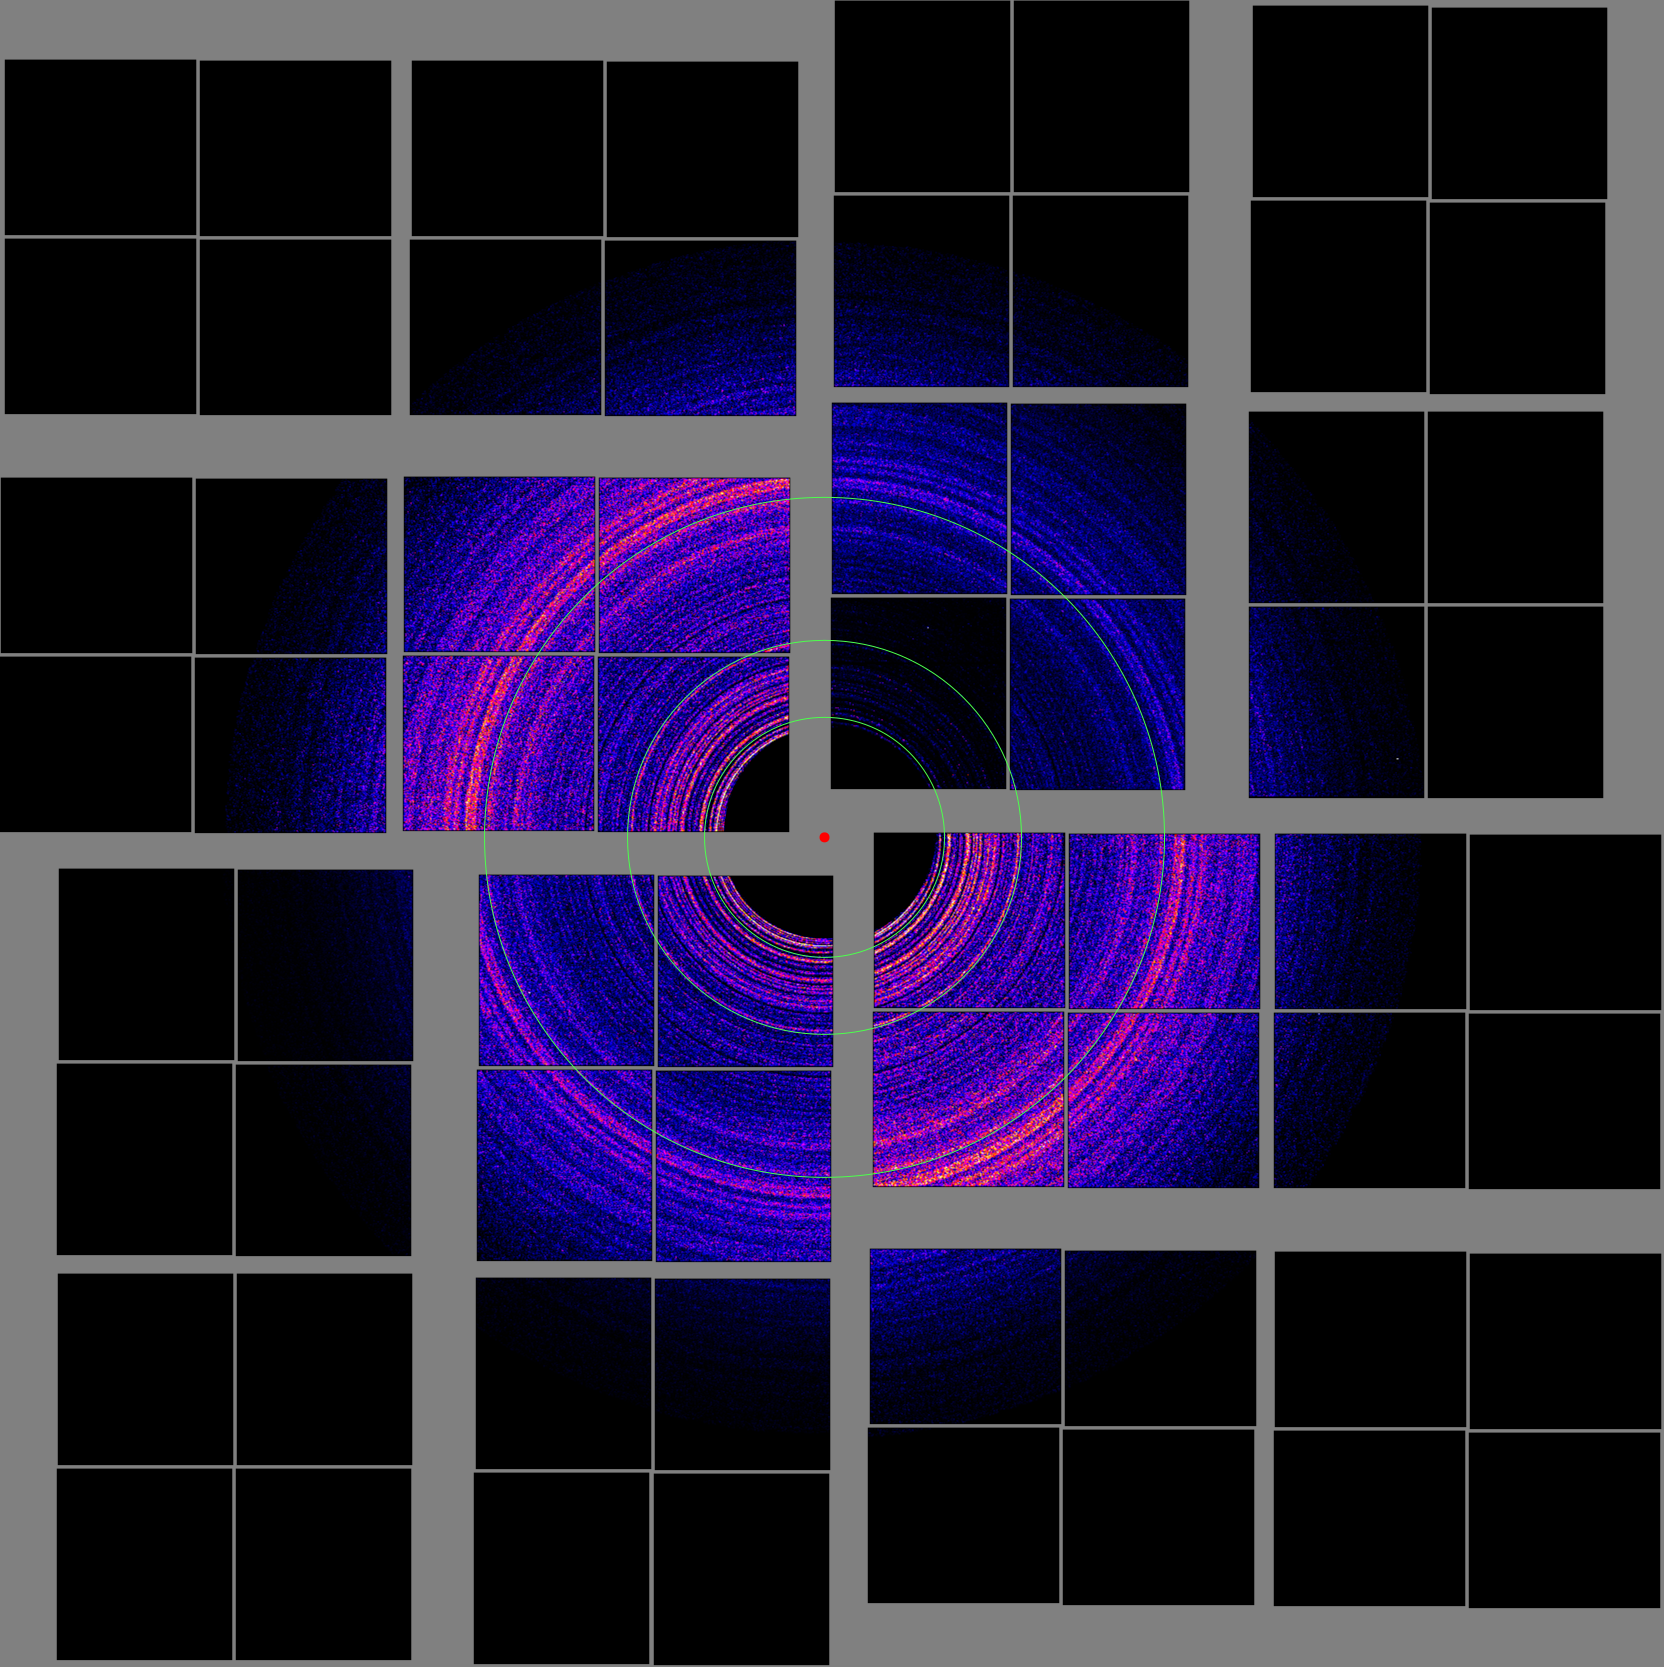
Images of panels in data for all detector orientations in metrology processing v1 without quads
- v1 of the metrology processing script represents simplest approach - each panel coordinates are taken as is to insert in the detector
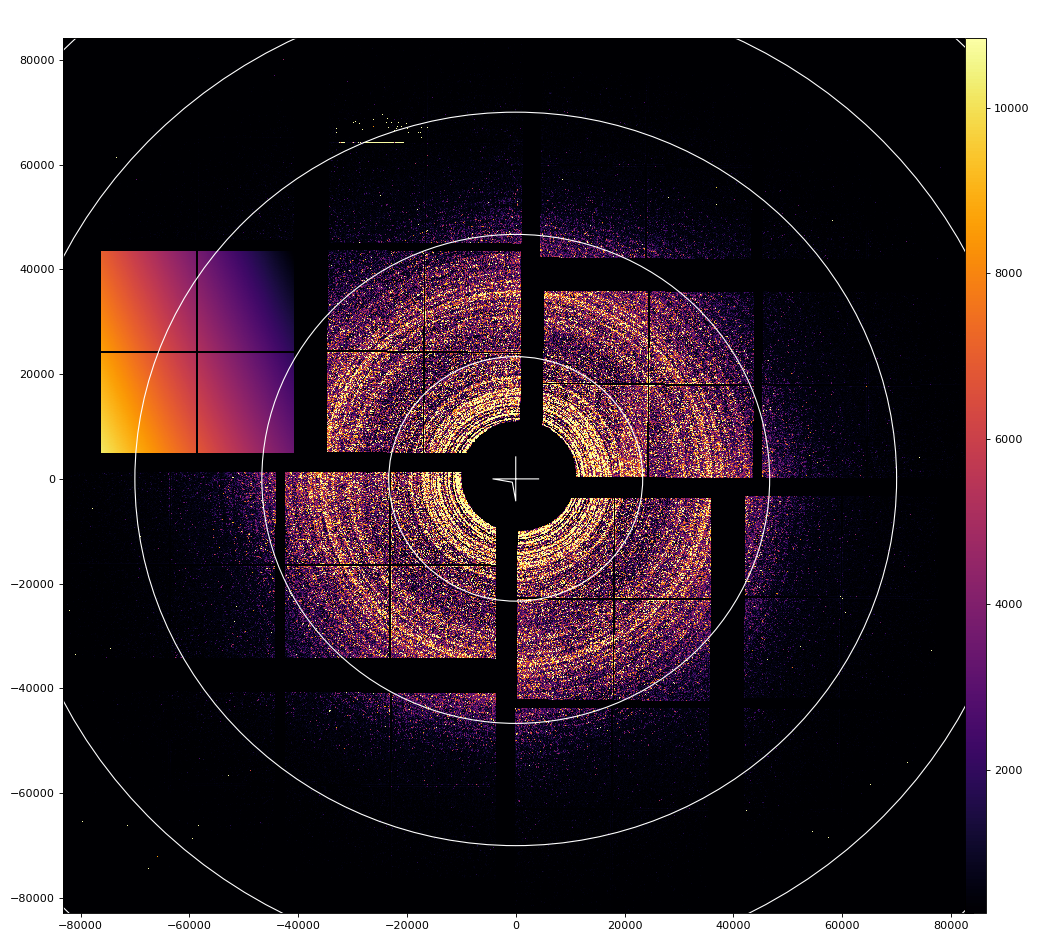
- data from mfxc00118 run44 silver-behenate sample
- data panel 1 (numerated from 0 to 15) is replaced by intensity ascending array, darkest corner is (0,0) pixel.


Summary:
- numeration of quads at rotation looks symmetric - so seems right
- one orientation of the detector gives correct image and it shows smallest offsets between panels in quads
Detector orientation in the hutch
mfxc00118 runs 70-73 for Fe55 in the corner of quad 0-3
epix10ka2m.1 orientation in the hutch, view from the beam (or on open panels)
   ^y          |
Q0 | Q1        |
---+----->x    |
Q3 | Q2        V g (gravity)
Panel 0 data is replaced by the ascending intensity array, (0,0) pixel is in the darkest corner.


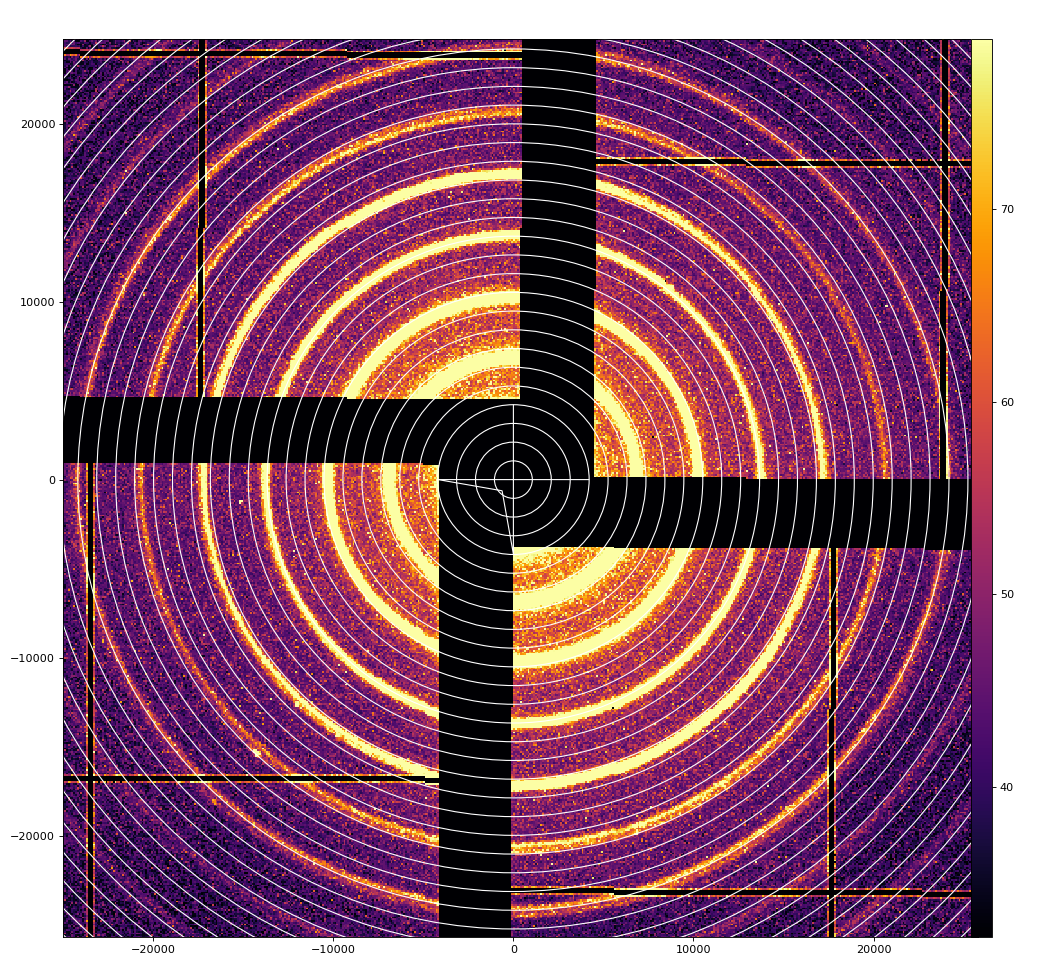
mfxc00118 run44 silver-behenate
panel 1 is marked

mfxc00318 run 10,13 lysozyme
psana direct and mirror image for crystfel
panel 0 is marked on full size image


Geometry files centered for mfxc00318 run13 lysozyme
- 2020-02-25-geometry-epix10ka2m.1-v1-mfxc00318-0013-z0.txt
- 2020-02-25-geometry-epix10ka2m.1-v1-mfxc00318-0013-z0-mirror.txt
- 2020-02-25-geometry-epix10ka2m.1-v1-mfxc00318-0013-z0-mirror-crystfel.txt
Geoptimizer or how geometry can be screwed-up
First, thanks to Olexandr and Marina for discovering how our geometry should be mapped to data array.
However, before solution was found, geoptimizer returned geometry which is significantly different from optical metrology, as shown in movie comparing panels before (from opt metrology) and after optimization.

- It is clear that blind application of geoptimizer may cause >1 mm offset of panels in x-y ...
- It is suggested to use geoptimizer for panels with fixed center and panel orientation in (x,y) from optical metrology and apply optimization for z coordinate and off-plane tilts. Z coordinates were not measured correctly in optical metrology.
- Next optical metrology is expected to be with precise (~10um) Z measurement.
References
- EPIX10KA2M References
- Optical metrology of epix10ka2m.0 from 2018-11-18
- Optical metrology of epix10ka2m.0 from 2020-06-25
- EPIX10KA2M and EPIX10KAQUAD
- EPIX10KA panel flatness measurement
Overview
Content Tools