The Covid-19 case history came from Johns Hopkins University (JHU) for: Confirmed cases and Deaths.
San Francisco Bay counties deaths/confirmed cases 8/25/20 Click on chart for more Information | San Francisco Bay counties smoothed daily cases per million population 8/25/20 Click on chart for more Information | San Francisco Bay counties smoothed daily cases per million population (log10 y scale) 8/25/20 Click on chart for more Information |
 |  |  |
San Francisco Bay Area counties % daily deaths/confirmed cases 8/10/20 Click on chart for more Information | San Francisco Bay Area counties Cumulative deaths per million population 8/10/20 Click on chart for more Information |
|---|---|
 |  |
San Francisco Bay Area daily confirmed cases / Million population (linear y axis) Click on chart for more Information | San Francisco Bay Area daily confirmed cases per Million population (log10 y axis) Click on chart for more Information |
|---|---|
 | 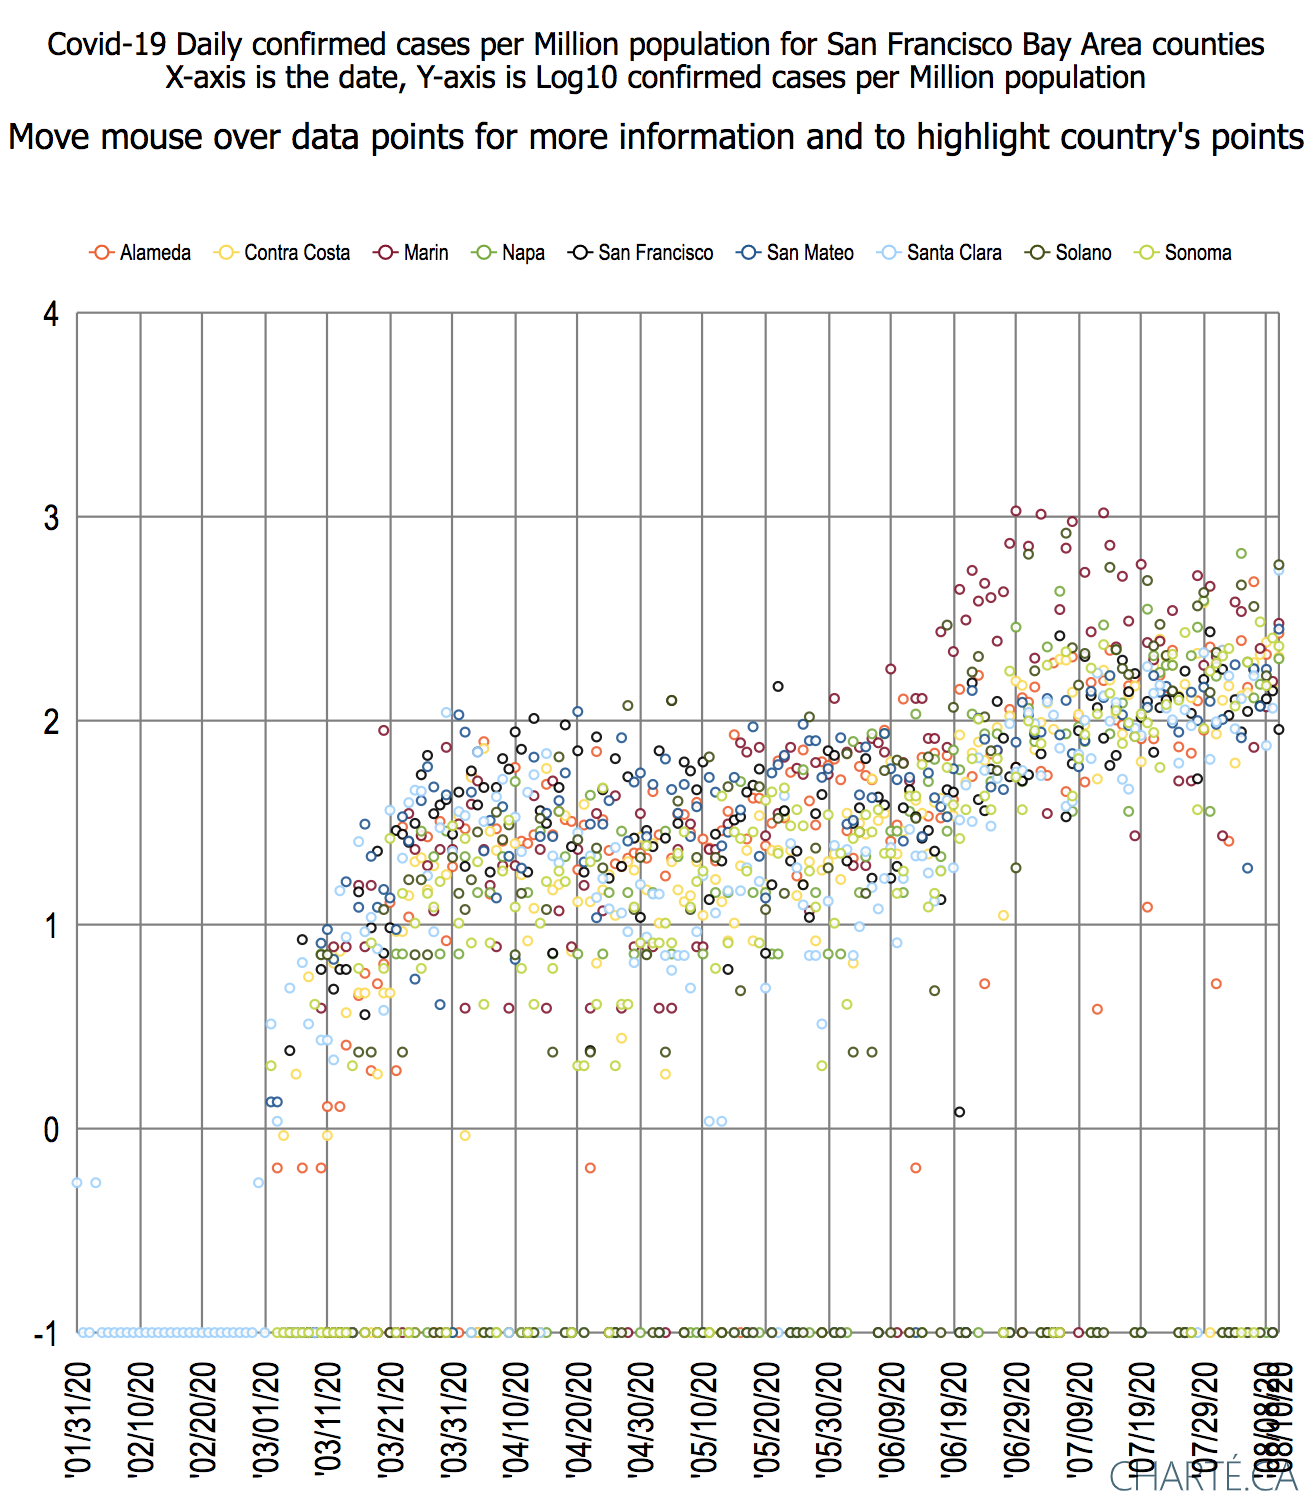 |
Observations:
- The first confirmed case was in Santa Clara 1/31/20.
- The first death was also in Santa Clara 3/10/2020.
- The second county to record a confirmed case was San Mateo on 3/16/2020.
- San Mateo took over the lead in cumulative deaths/Million population at the end of March, only to be overtaken by Marin mod July.
- All counties started to reduce the ratio deaths/confirmed cases after 5/5/2020.,
- Santa Clara, San Mateo, San Francisco, Contra Costa, Alameda, and Solano continue to reduce the ratio of deaths/confirmed cases.
- There was an uptick in the ratio of deaths/confirmed cases in Sonoma starting around 6/29/2020.
- There was an uptick in the ratio of deaths/confirmed cases in Marin starting around 7/3/2020.
- There was an uptick in the ratio of deaths/confirmed cases in Napa starting around 7/18/2020.
- Marin has recorded the highest daily confirmed cases/Million population. Also see https://abc7news.com/covid-cases-latino-california-coronavirus-marin-county/6329375/.
- Marin has also recorded the highest cumulative deaths per Million population