| Name
|
Size
|
Creator |
Creation Date
|
Last Modification Date
|
Labels |
Attached To |
|
PNG File Screen Shot 2020-09-16 at 12.29.37 PM.png |
402 kB |
Les Cottrell |
Sep 16, 2020 12:30 |
Sep 16, 2020 12:30 |
|
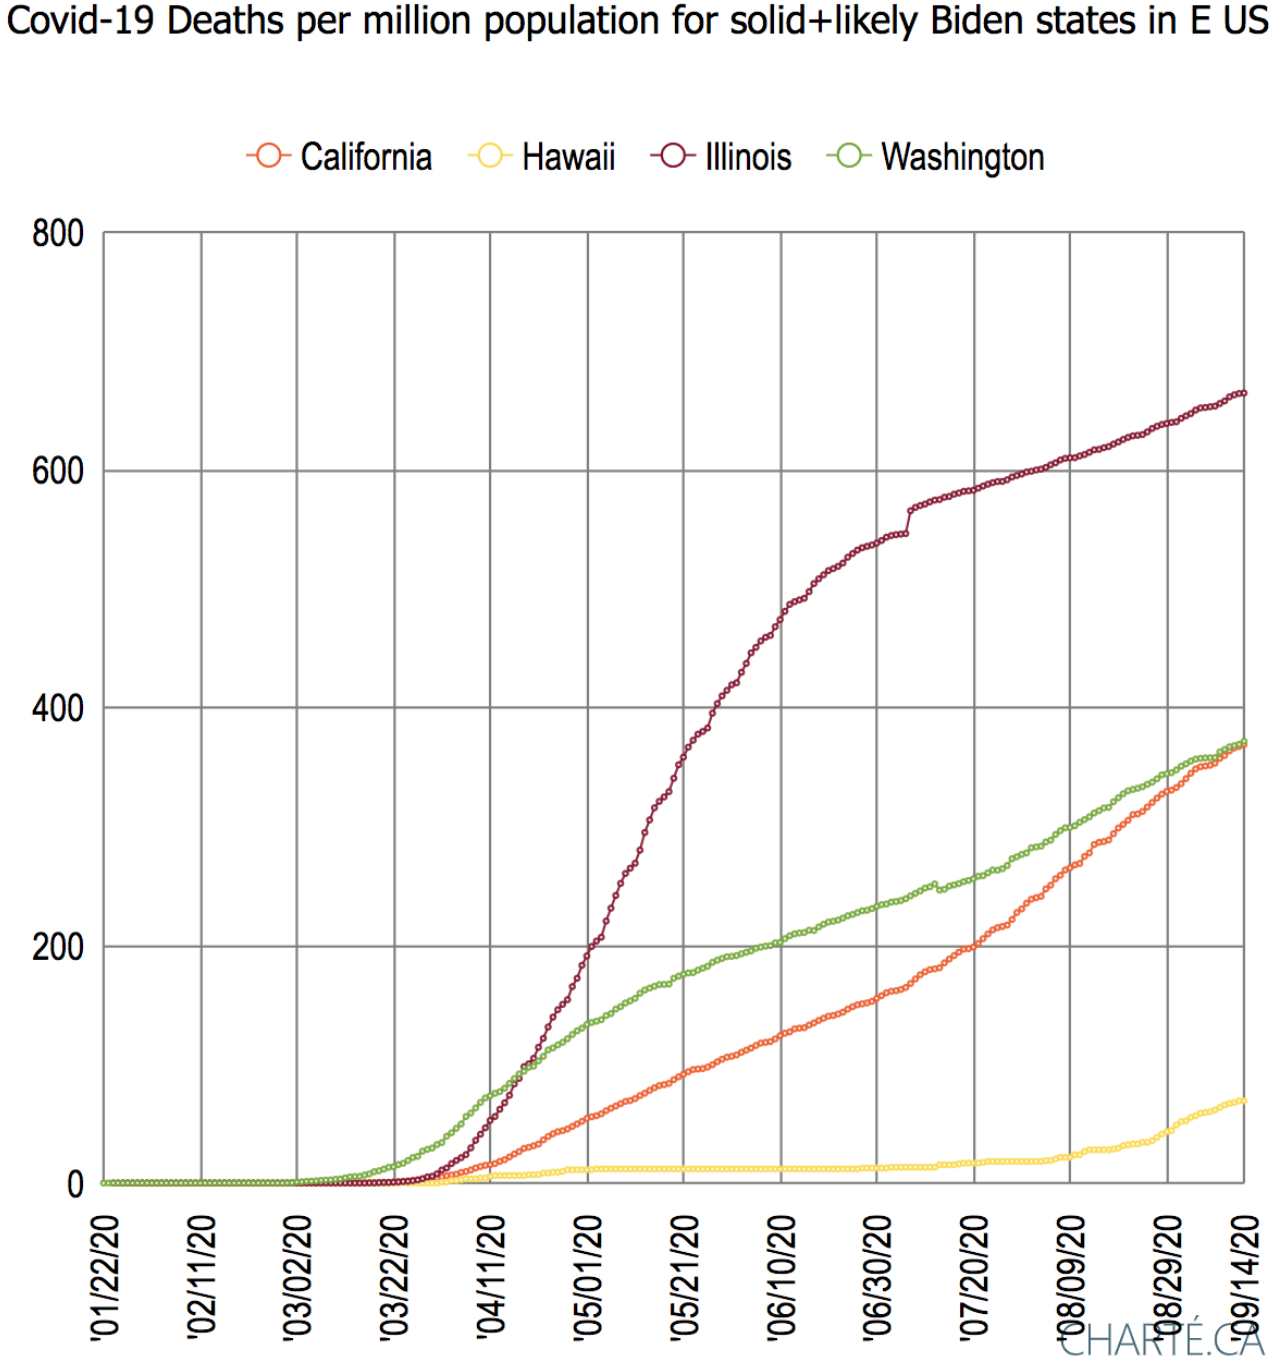
Page: Covid-19 US deaths by states
|
|
PNG File Screen Shot 2019-09-14 at 5.41.57 PM.png |
401 kB |
Les Cottrell |
Sep 14, 2019 17:44 |
Sep 14, 2019 17:44 |
|
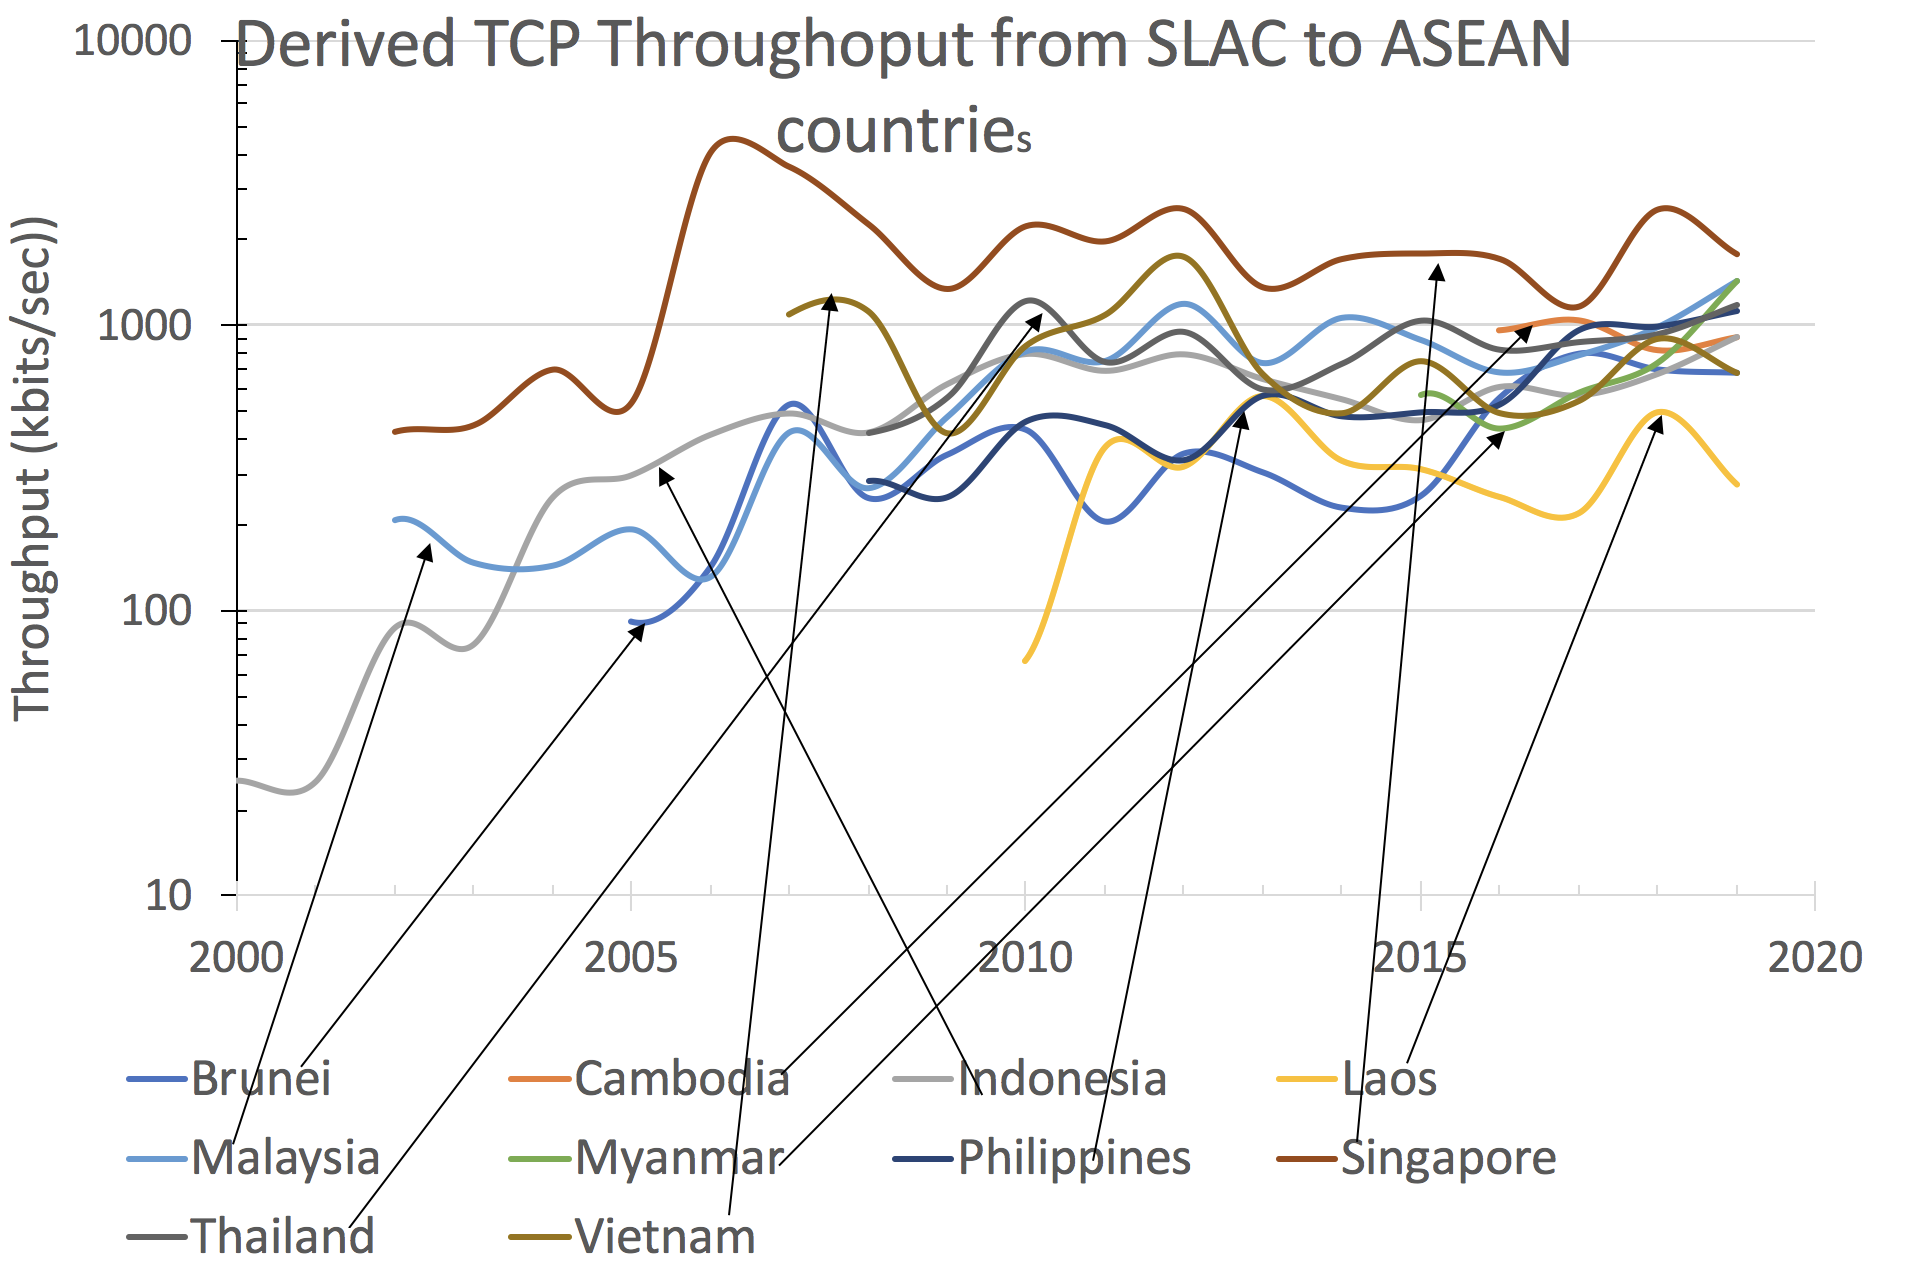
Page: PingER comparisons with other measurements
|
|
PNG File Screen Shot 2021-03-25 at 4.28.38 PM.png |
401 kB |
Les Cottrell |
Mar 25, 2021 16:29 |
Mar 25, 2021 16:29 |
|
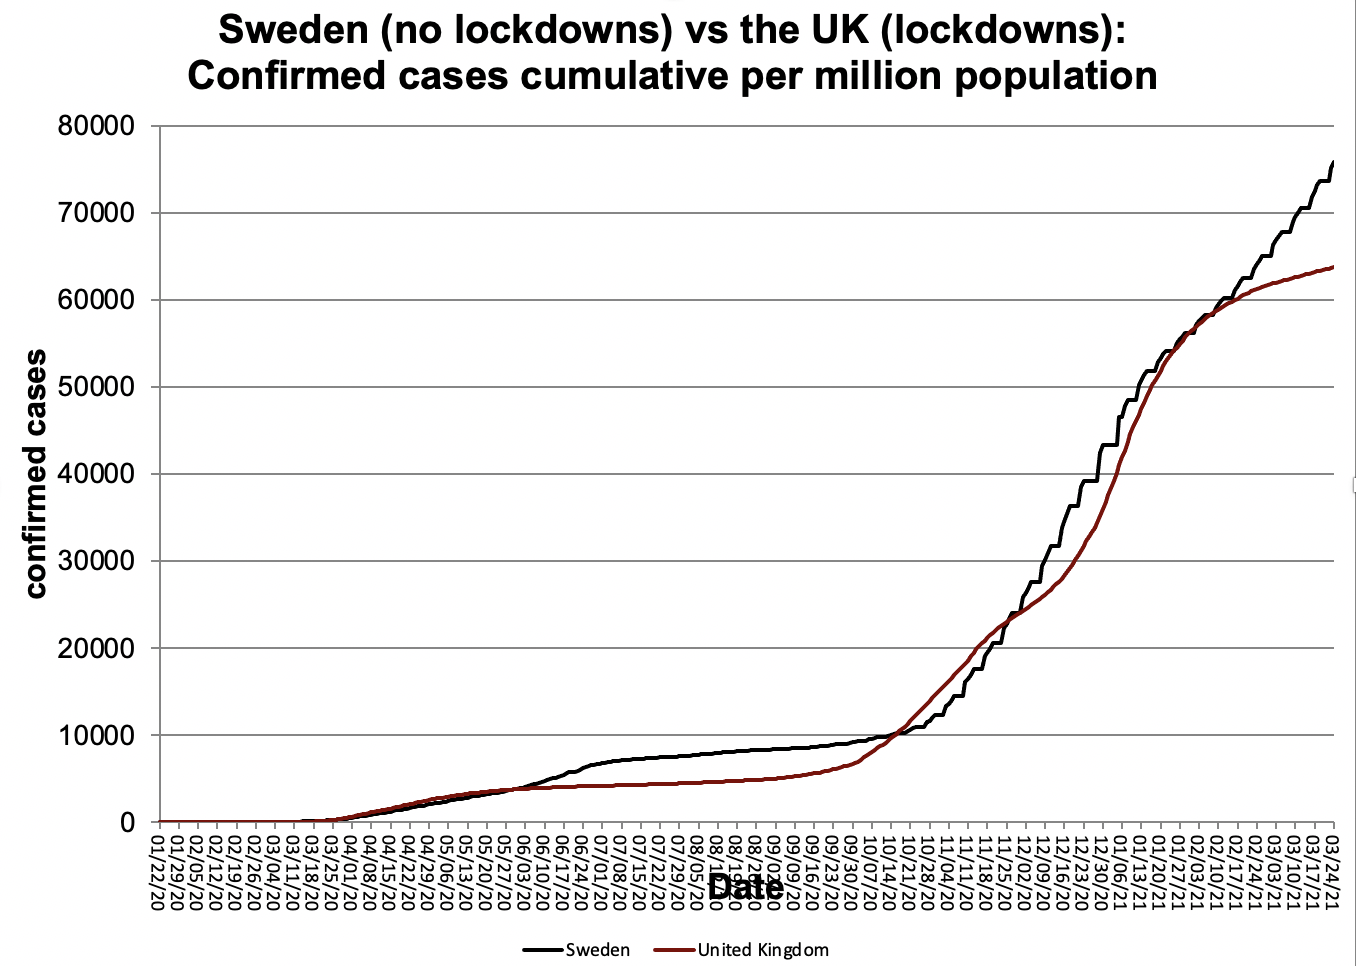
Page: Covid-19 UK vs Sweden vs other Scandinavian and W. European countries and lockdowns
|
|
PNG File Screen Shot 2021-01-26 at 9.38.19 PM.png |
401 kB |
Les Cottrell |
Jan 26, 2021 21:46 |
Jan 26, 2021 21:46 |
|
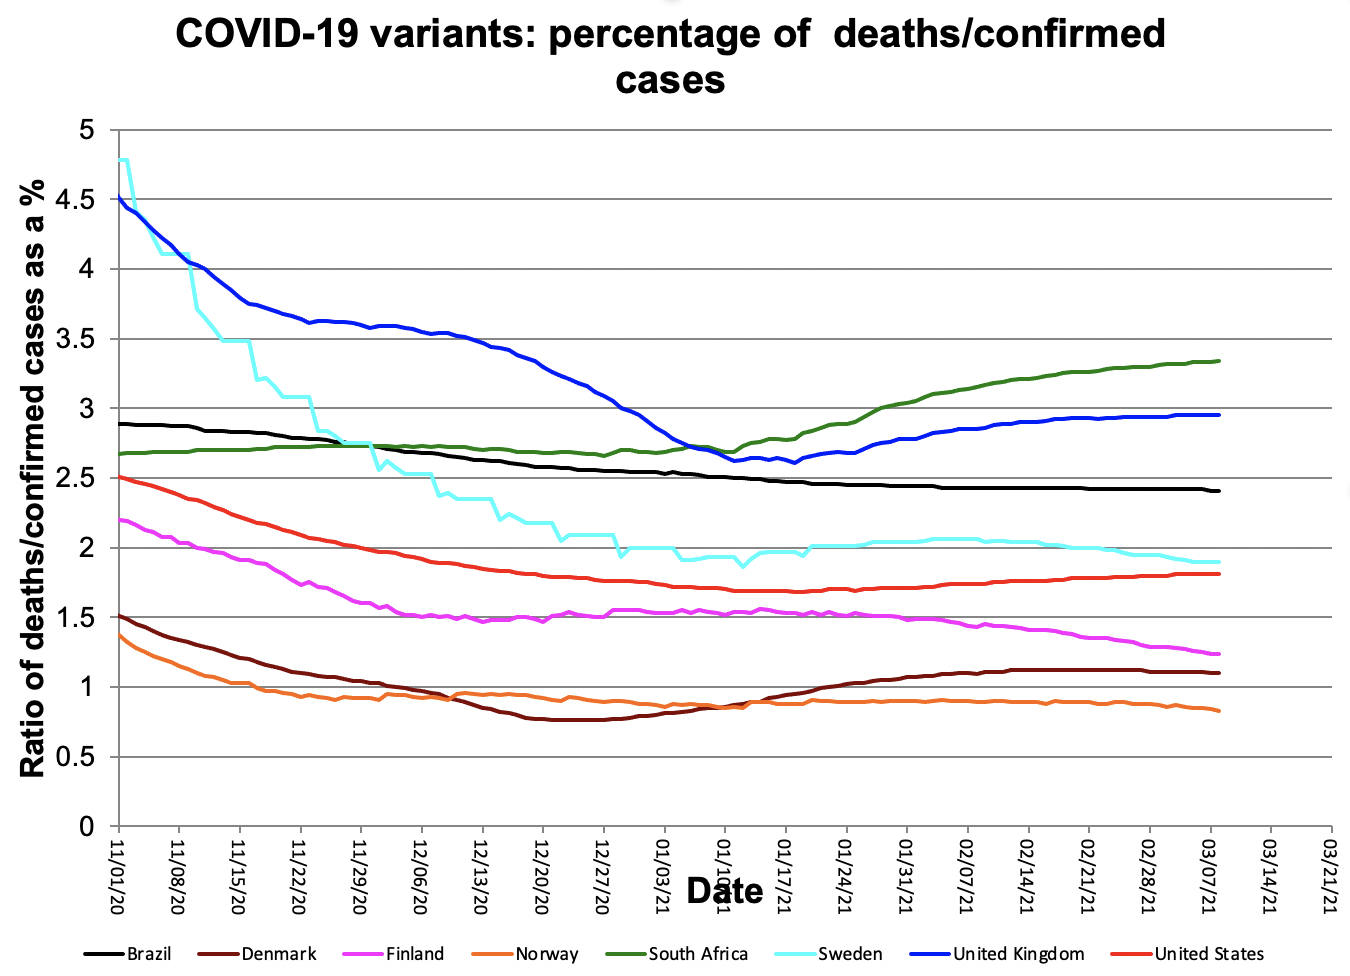
Page: Covid-19 Comparing the ratio of Deaths to Confirmed cases for representative countries
|
|
PNG File Screen Shot 2020-08-15 at 2.47.24 PM.png |
400 kB |
Les Cottrell |
Aug 15, 2020 14:48 |
Aug 15, 2020 15:24 |
|
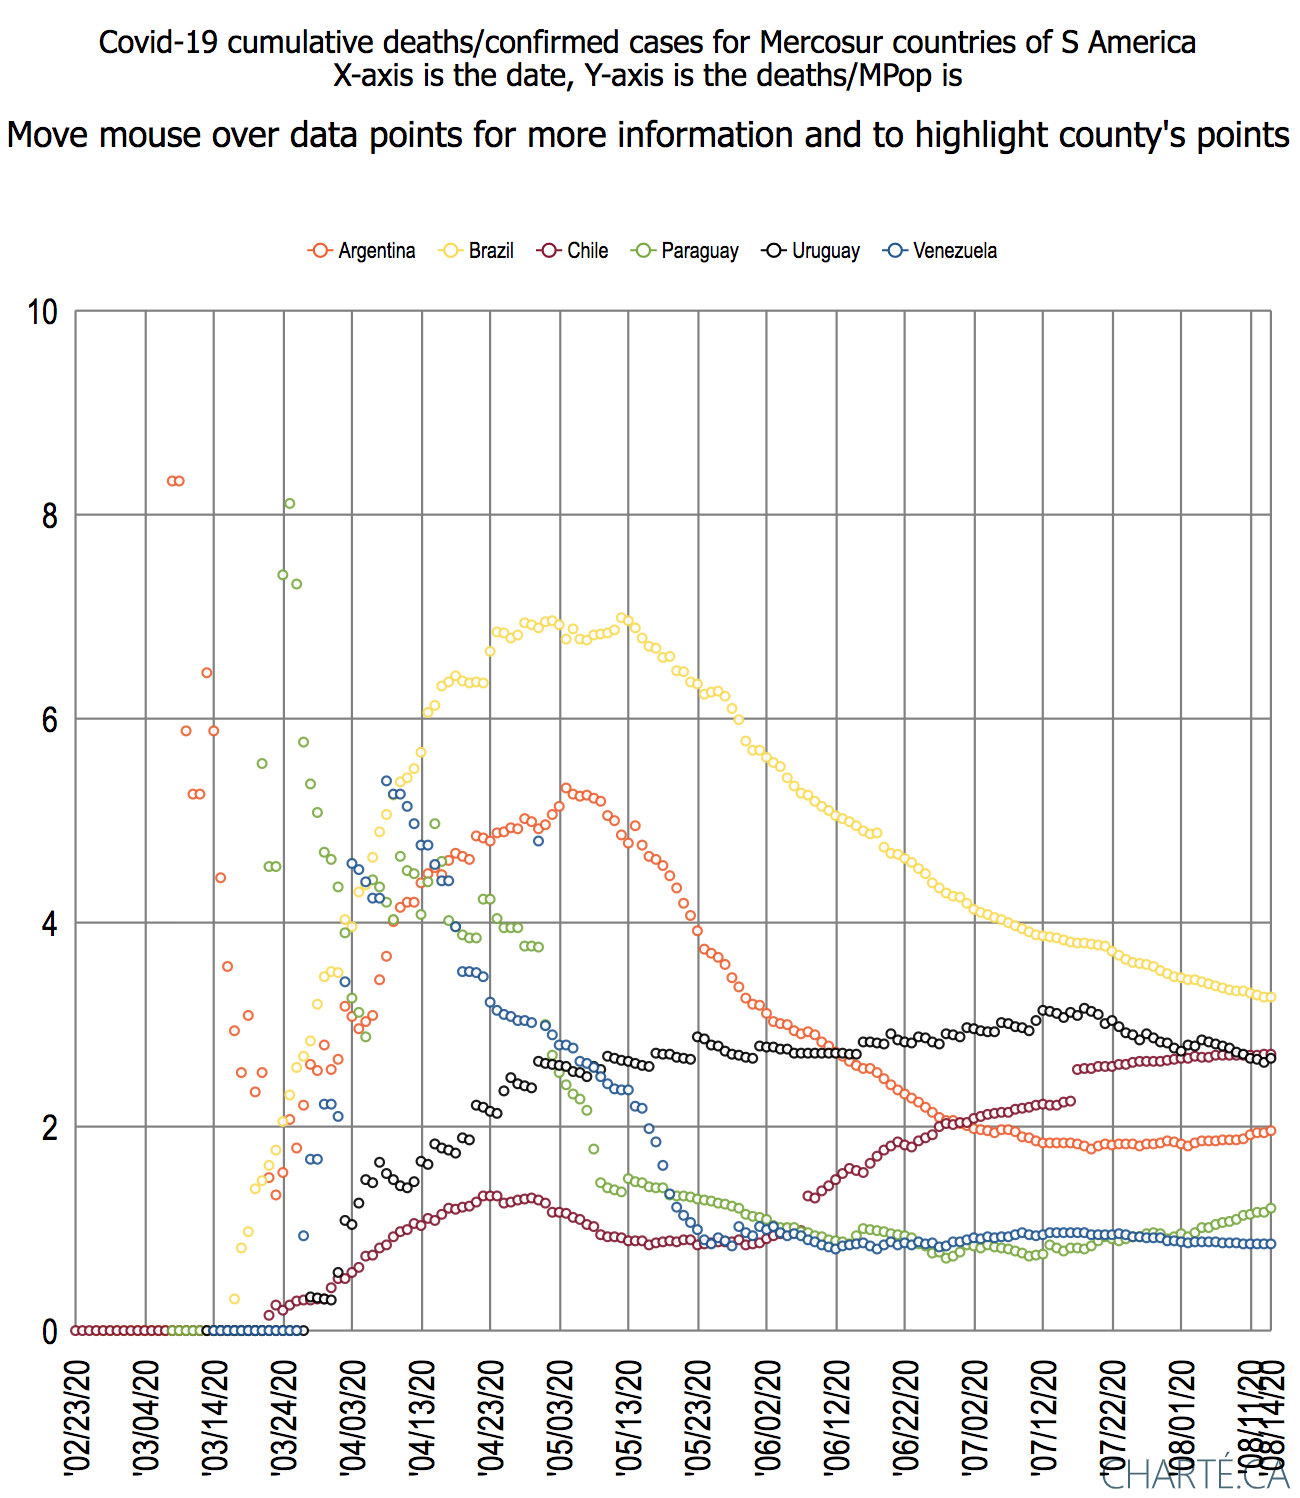
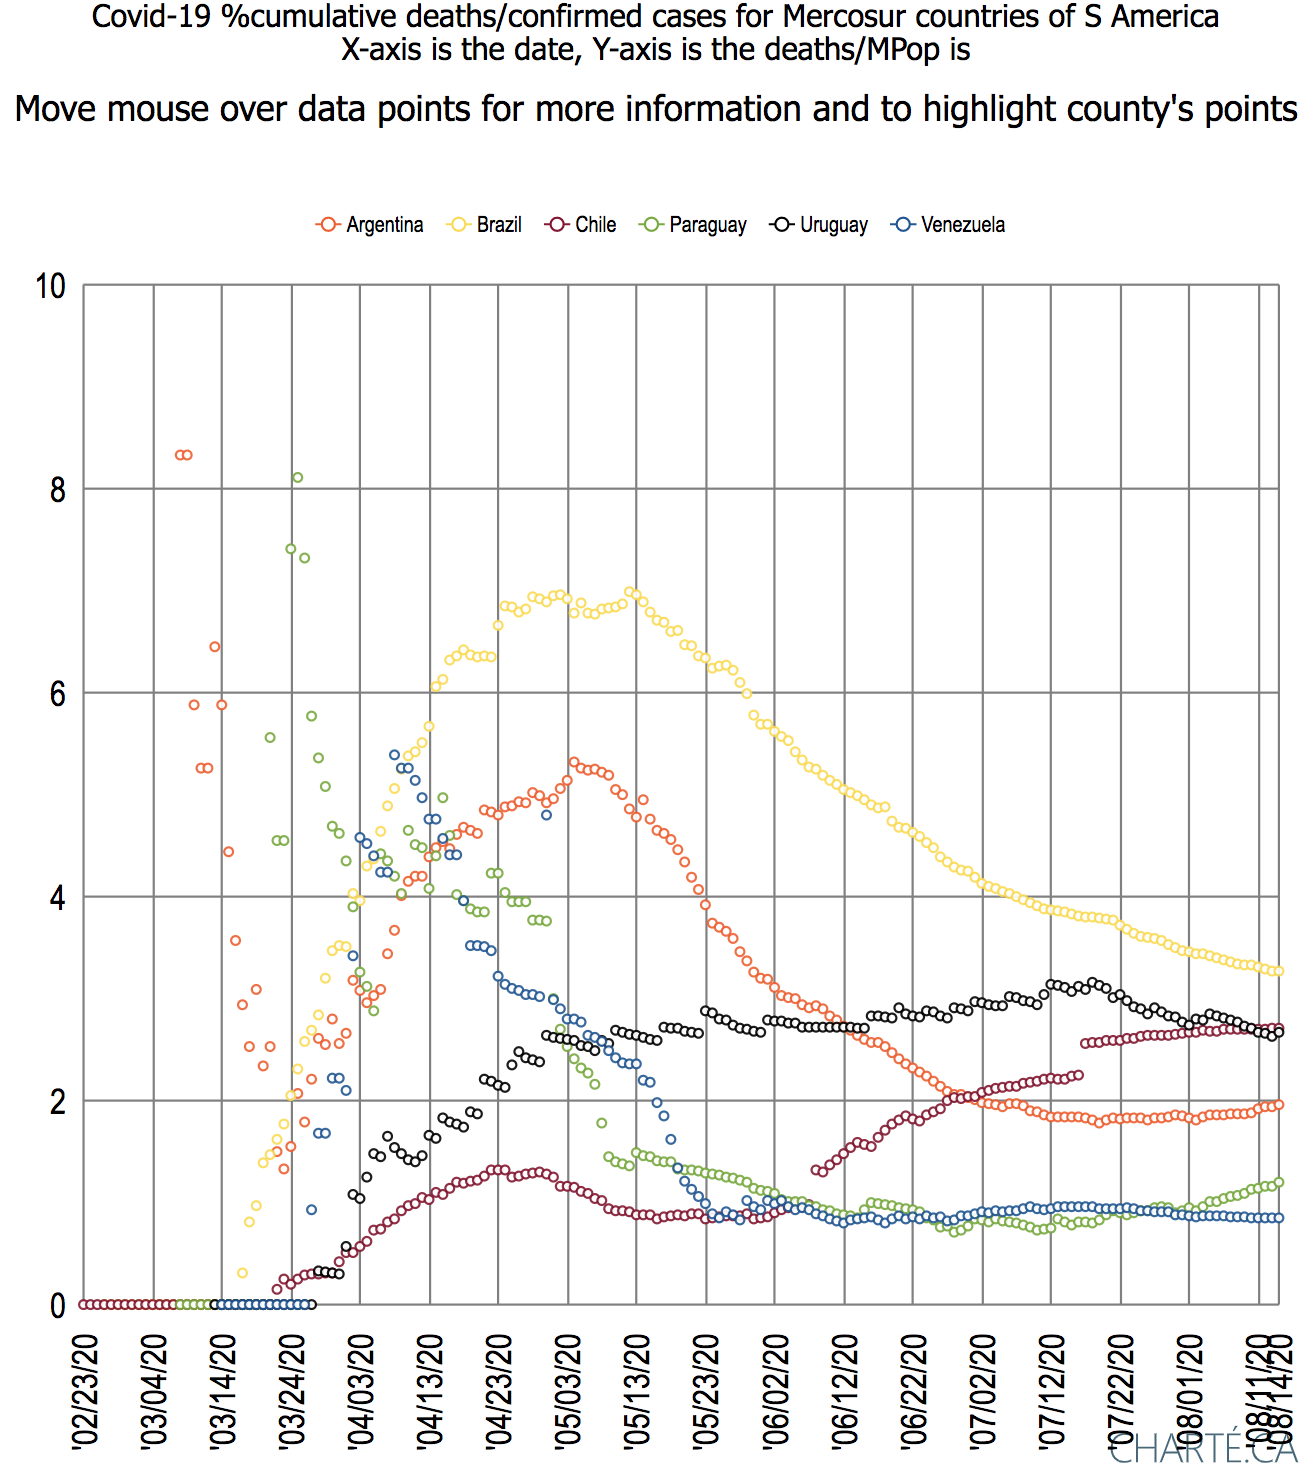
Page: Covid-19 South America
|
|
PNG File Screen Shot 2020-08-15 at 4.21.02 PM.png |
400 kB |
Les Cottrell |
Aug 15, 2020 16:21 |
Aug 15, 2020 16:21 |
|
Page: Covid-19 South America
|
|
PNG File Screen Shot 2022-11-11 at 5.49.06 PM.png |
400 kB |
Les Cottrell |
Nov 11, 2022 17:49 |
Nov 11, 2022 17:49 |
|
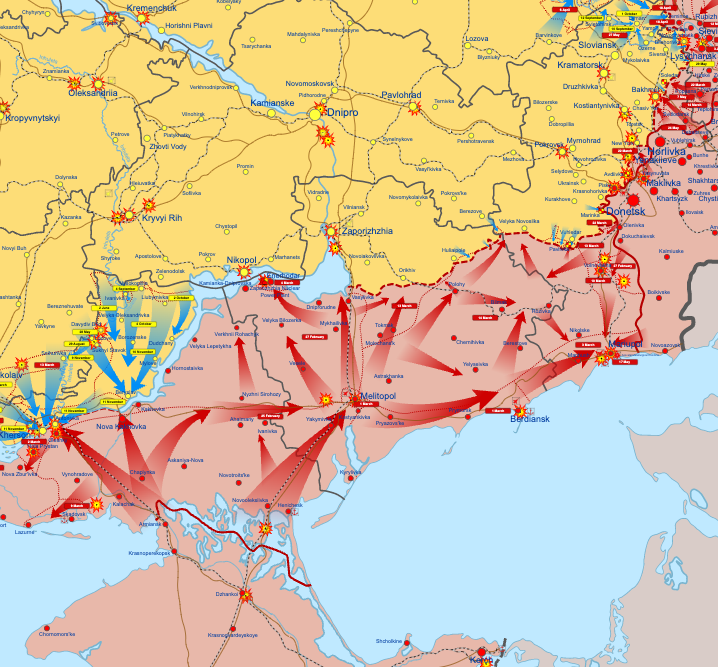
Page: Impact of the Russo Ukraine war on ping response times
|
|
PNG File Screen Shot 2020-08-12 at 4.45.28 PM.png |
399 kB |
Les Cottrell |
Aug 12, 2020 16:56 |
Aug 12, 2020 16:56 |
|
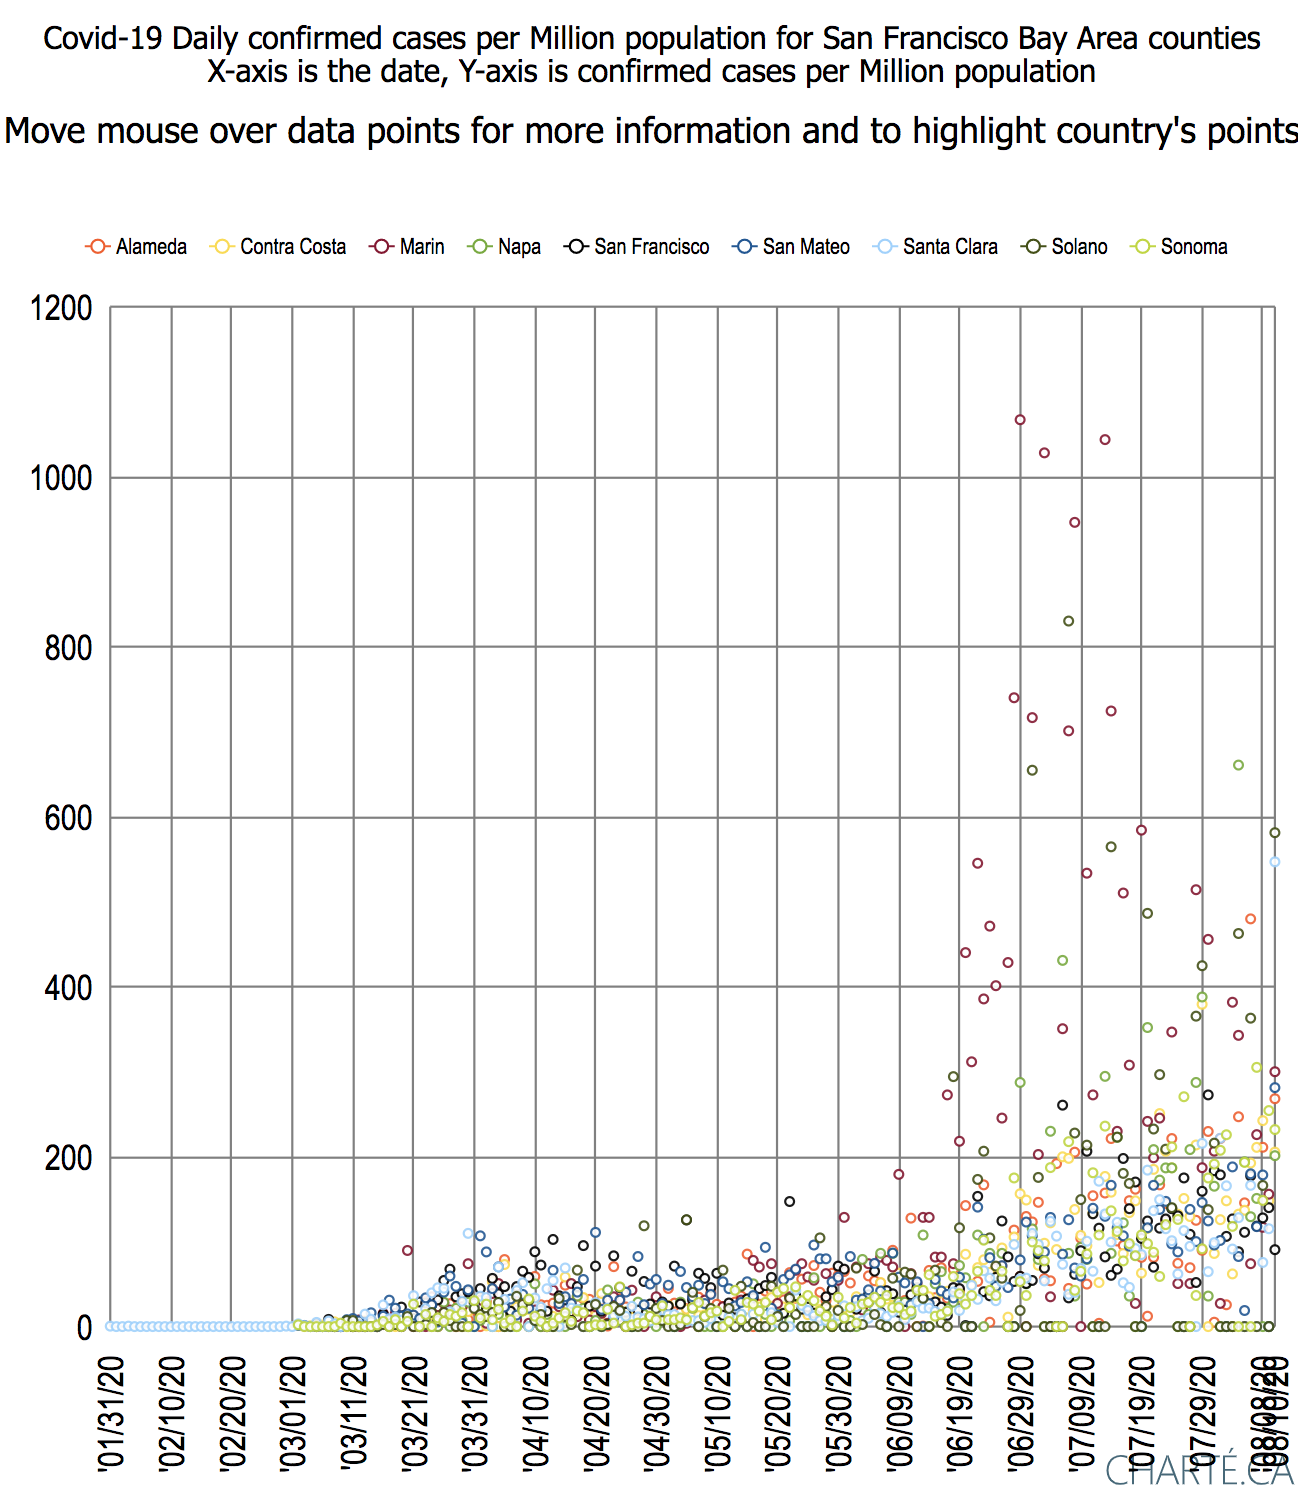
Page: Covid-19 - Visualizing California data
|
|
PNG File Screen Shot 2021-03-09 at 3.13.37 PM.png |
399 kB |
Les Cottrell |
Mar 09, 2021 15:14 |
Mar 09, 2021 17:21 |
|
Page: Covid-19 impact of new strains
|
|
PNG File Screen Shot 2021-07-27 at 10.34.50 AM.png |
399 kB |
Les Cottrell |
Jul 27, 2021 10:36 |
Jul 27, 2021 10:36 |
|
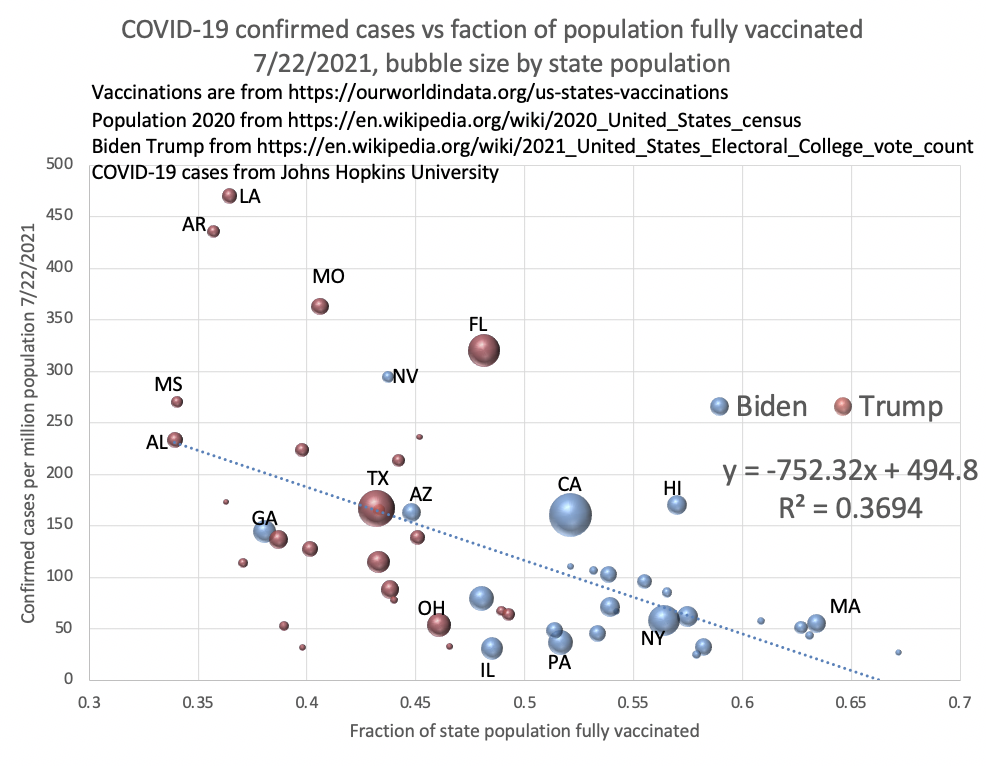
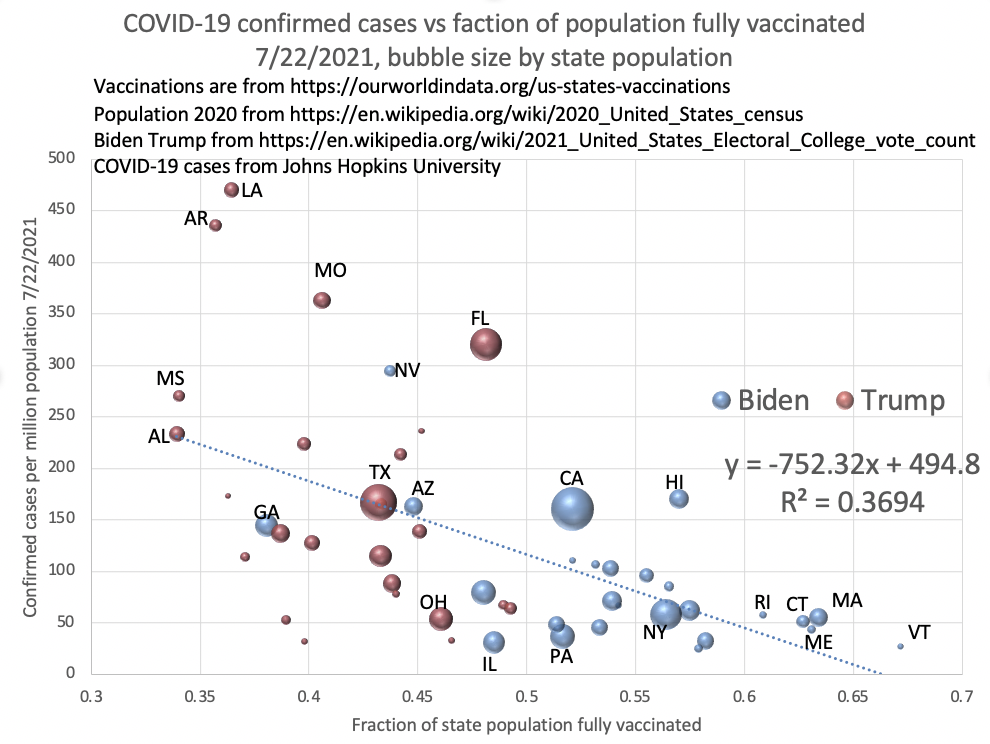
Page: Covid-19 July 21, 2021
|
|
PNG File Screen Shot 2021-07-28 at 8.11.35 AM.png |
399 kB |
Les Cottrell |
Jul 28, 2021 08:45 |
Jul 28, 2021 08:45 |
|
Page: Covid-19 July 21, 2021
|
|
PNG File Screen Shot 2020-03-27 at 5.46.38 PM.png |
399 kB |
Les Cottrell |
Mar 27, 2020 17:49 |
Mar 27, 2020 17:49 |
|
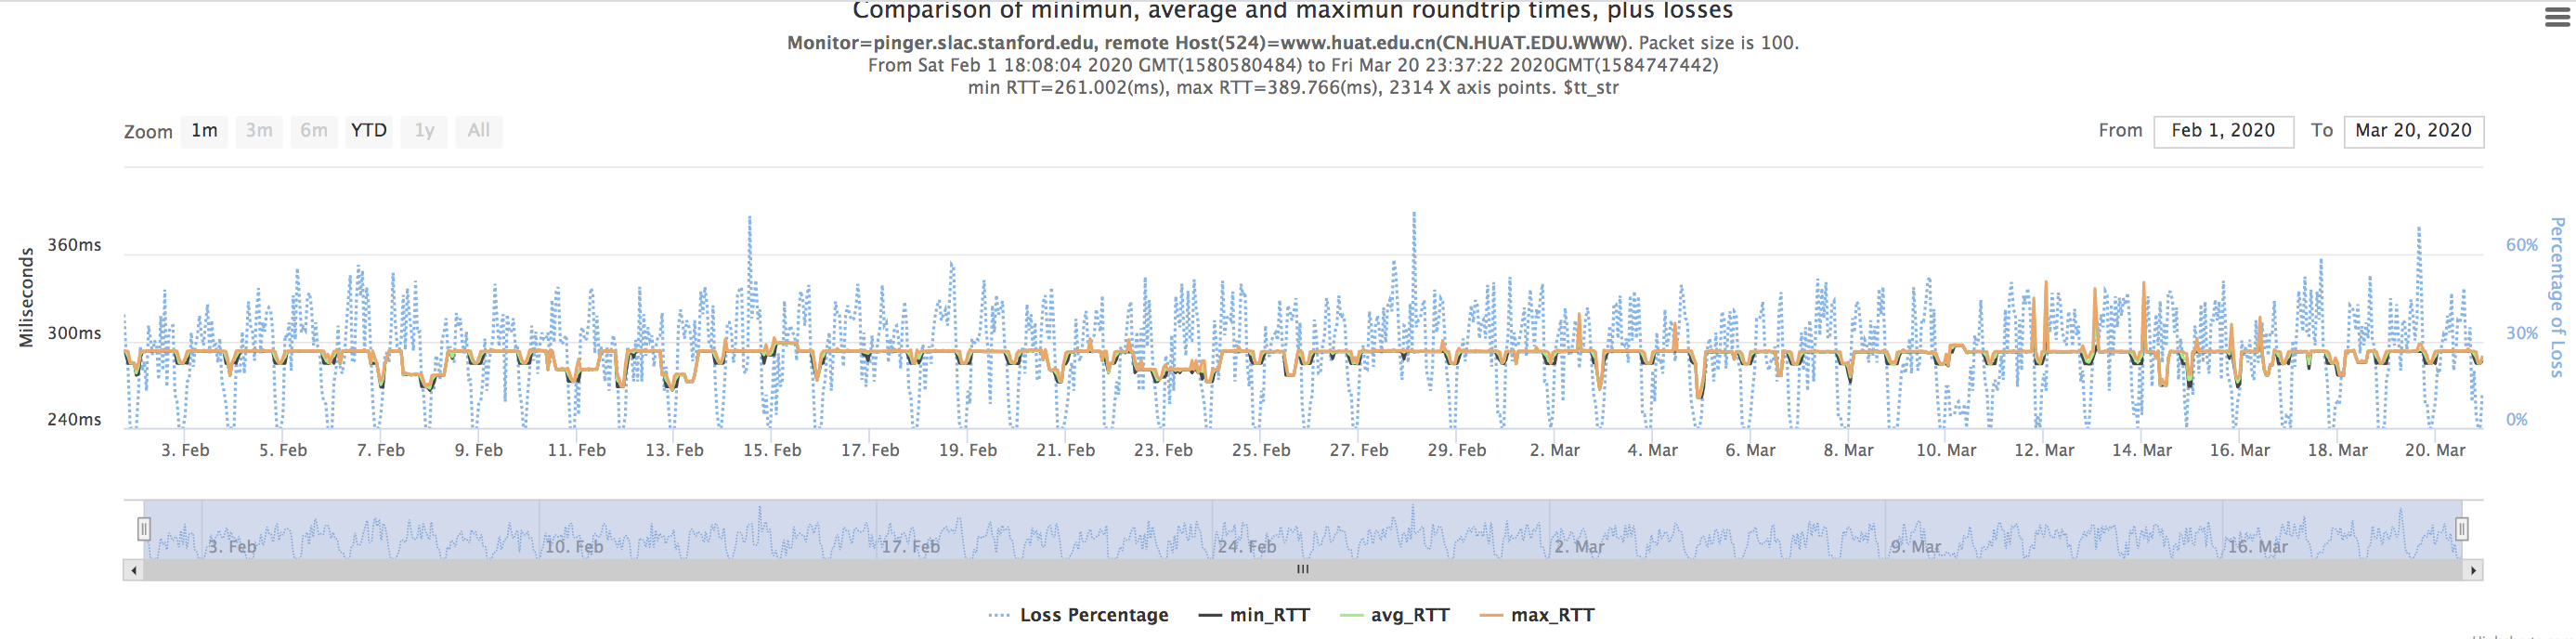
Page: PingER and COVID-19
|
|
PDF File Installation Instructions.pdf |
398 kB |
Les Cottrell |
Oct 19, 2019 18:13 |
Oct 19, 2019 18:13 |
|
Page: ePingER Functional prototype
|
|
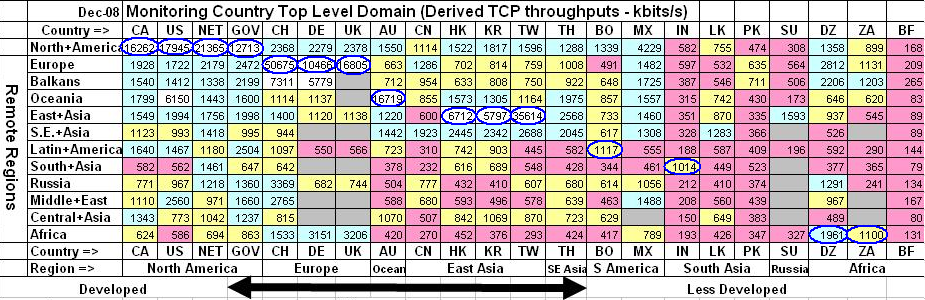
PNG File performance-dec-matrix.png |
398 kB |
Unknown User (umar.kalim) |
Jan 27, 2009 19:15 |
Jan 27, 2009 19:15 |
|
Page: Sub-Saharan Africa - Revised Statistics (2008)
|
|
Microsoft Powerpoint Presentation ipam-pow.pptx |
397 kB |
Les Cottrell |
Oct 28, 2014 07:49 |
Oct 28, 2014 07:49 |
|
Page: Papers and Presentations
|
|
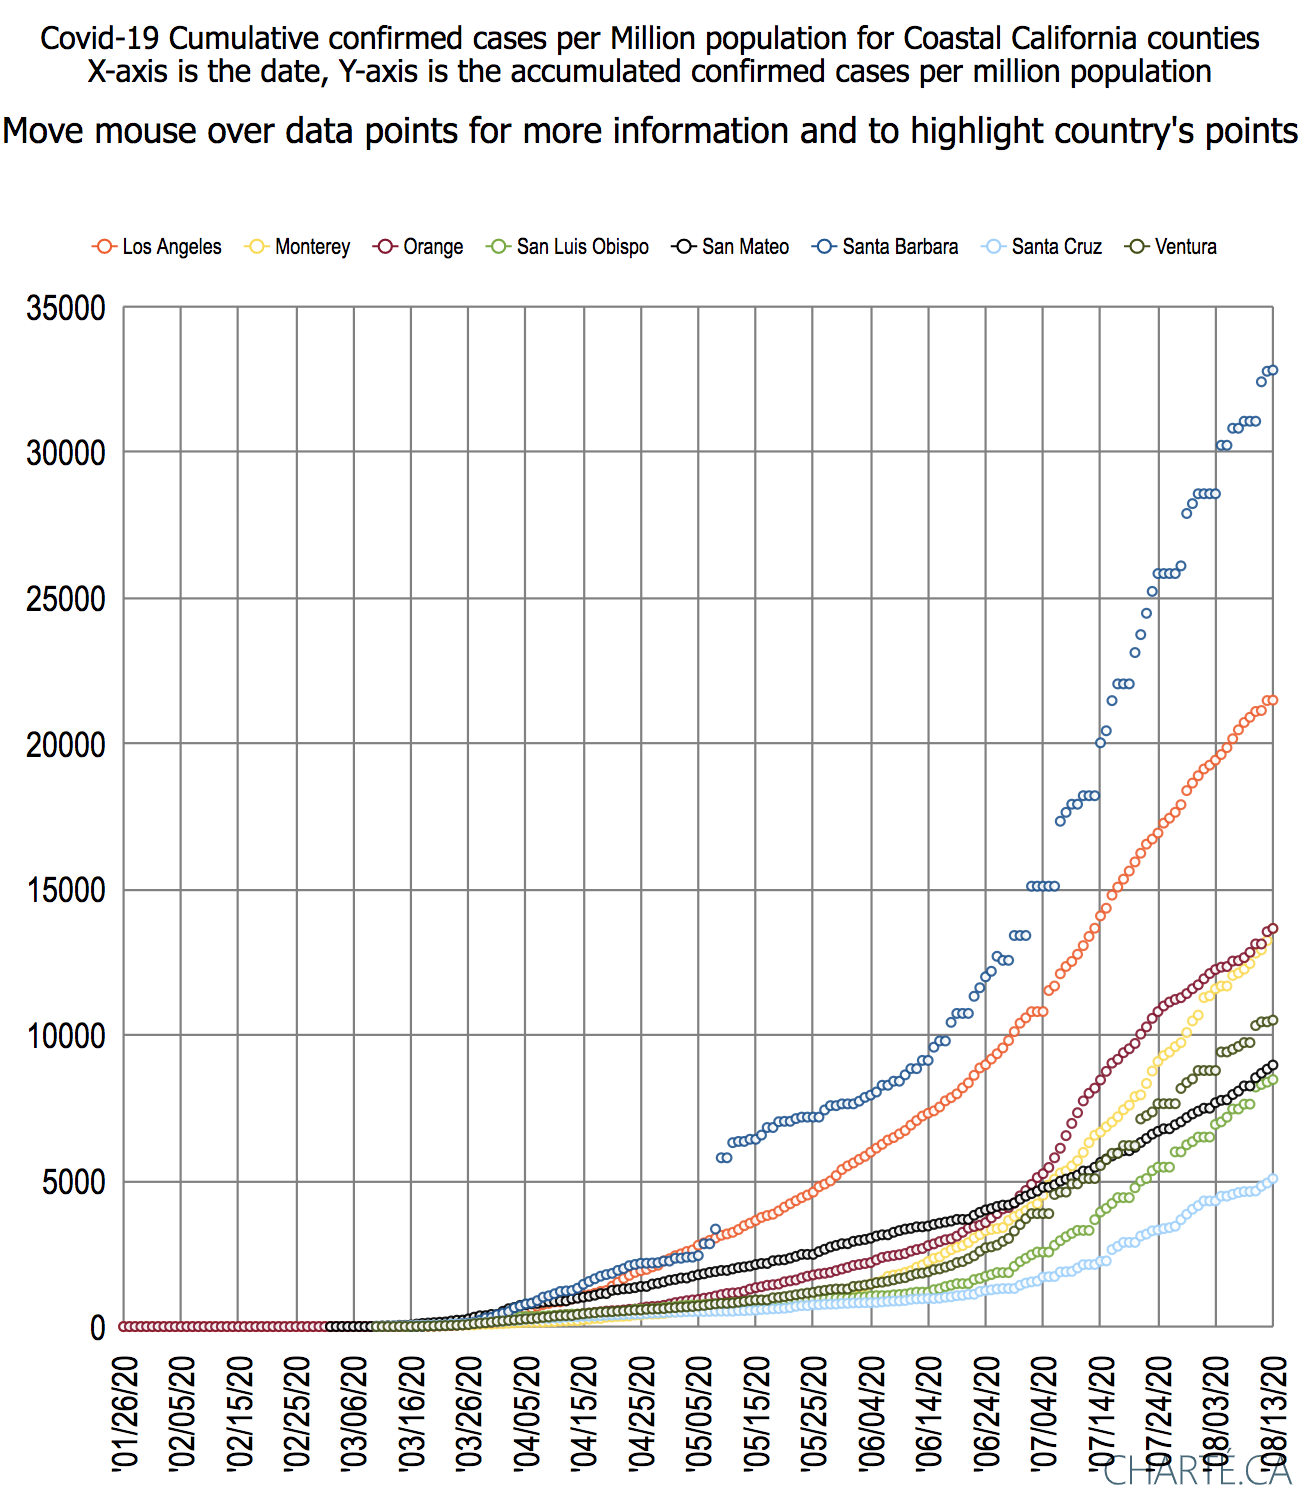
PNG File Screen Shot 2020-08-14 at 11.19.02 AM.png |
397 kB |
Les Cottrell |
Aug 14, 2020 11:22 |
Aug 14, 2020 14:14 |
|
Page: Covid-19 California coastal counties from San Mateo southwards
|
|
PNG File Screen Shot 2020-08-12 at 4.43.09 PM.png |
396 kB |
Les Cottrell |
Aug 12, 2020 16:47 |
Aug 12, 2020 16:47 |
|
Page: Covid-19 - Visualizing California data
|
|
PNG File Screen Shot 2021-01-24 at 1.55.37 PM.png |
396 kB |
Les Cottrell |
Jan 24, 2021 13:56 |
Jan 24, 2021 13:56 |
|
Page: Covid-19 Comparing the ratio of Deaths to Confirmed cases for representative countries
|
|
PNG File Screen Shot 2021-01-24 at 1.55.37 PM.png |
396 kB |
Les Cottrell |
Jan 30, 2021 13:31 |
Jan 30, 2021 13:31 |
|
Page: Covid-19 Estimating delays between confirmed cases and deaths
|
|
PNG File Screen Shot 2020-11-20 at 2.34.04 PM.png |
396 kB |
Les Cottrell |
Nov 20, 2020 14:35 |
Nov 20, 2020 14:35 |
|
Page: Covid-19 comparisons by region
|