| Name
|
Size
|
Creator |
Creation Date
|
Last Modification Date
|
Labels |
Attached To |
|
PNG File Screen Shot 2020-08-13 at 6.57.06 PM.png |
425 kB |
Les Cottrell |
Aug 13, 2020 18:58 |
Aug 13, 2020 18:58 |
|
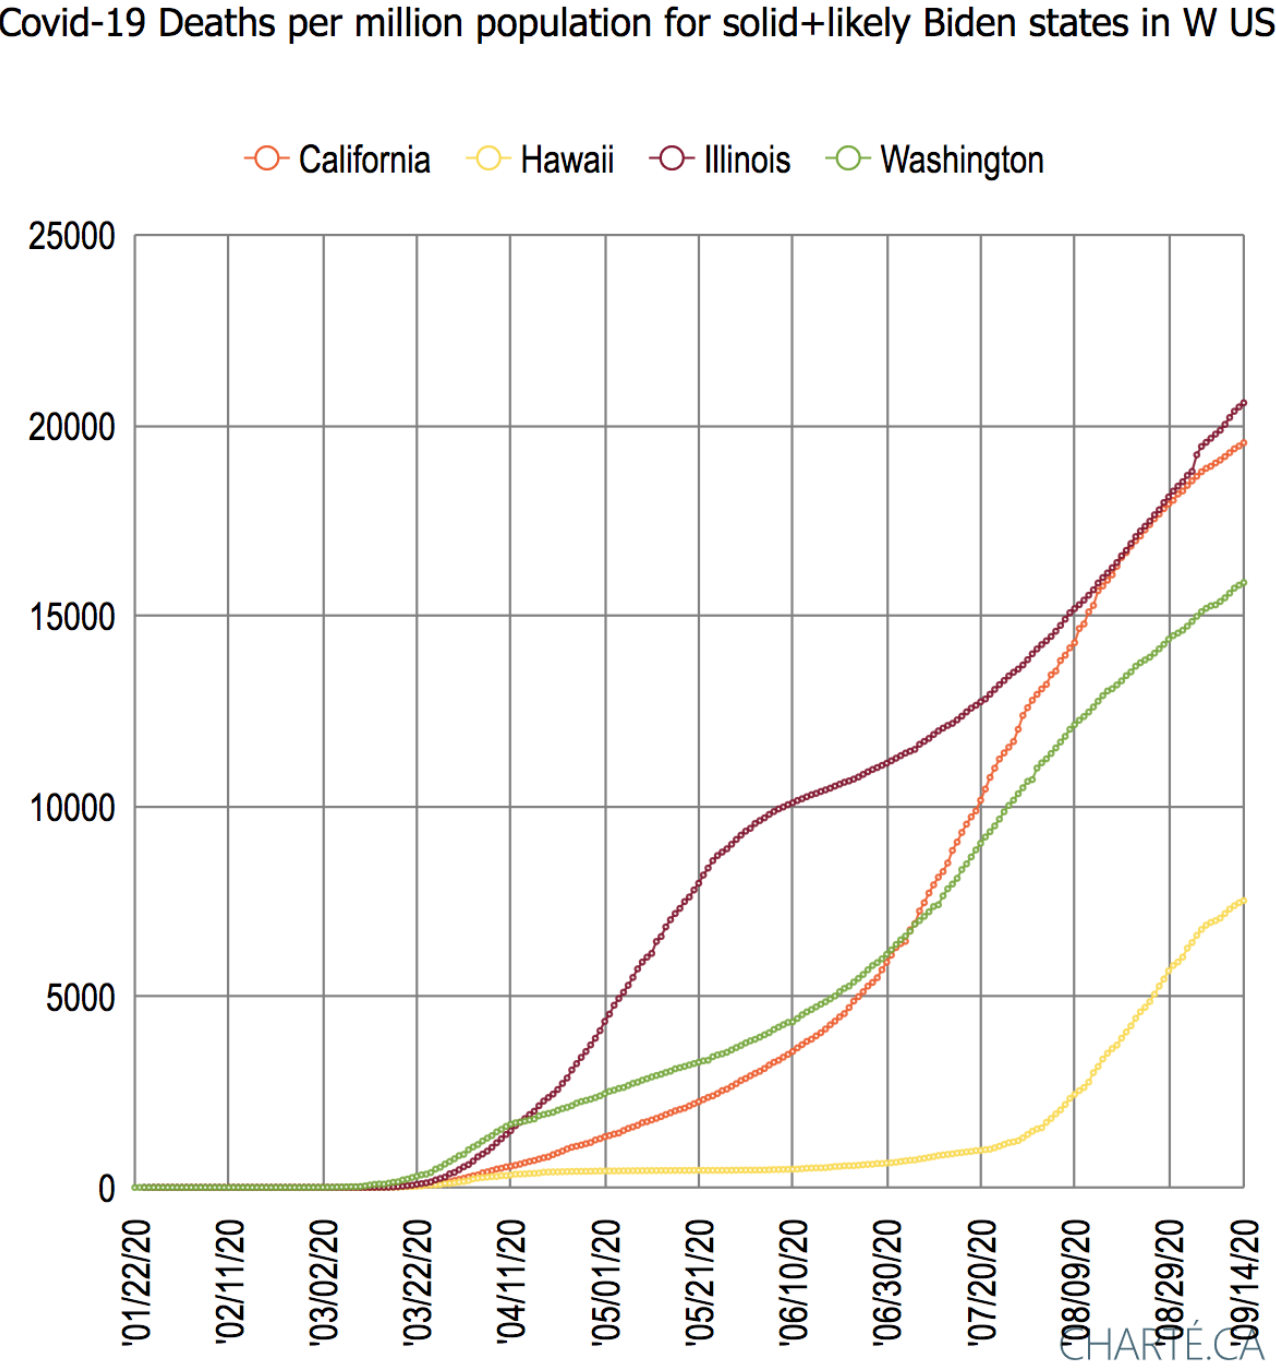
Page: Covid-19 - Visualizing California data
|
|
PNG File Screen Shot 2021-01-16 at 8.59.46 PM.png |
424 kB |
Les Cottrell |
Jan 16, 2021 21:01 |
Jan 16, 2021 21:01 |
|
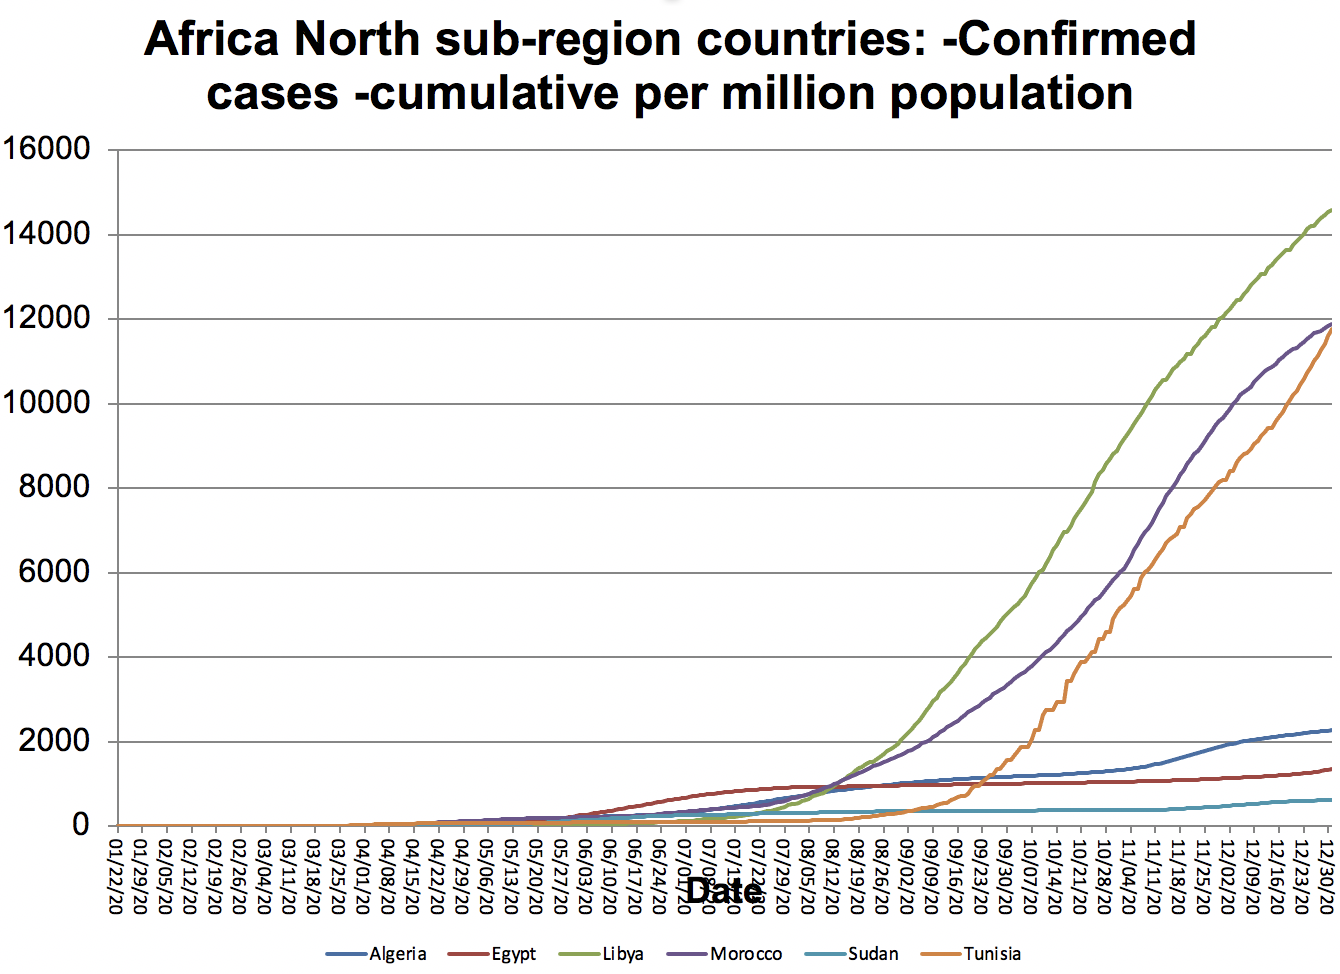
Page: Africa
|
|
PNG File Screen Shot 2021-01-16 at 8.59.46 PM.png |
424 kB |
Les Cottrell |
Jan 16, 2021 21:13 |
Jan 16, 2021 21:13 |
|
Page: Covid-19 bulletins
|
|
PNG File Screen Shot 2020-09-16 at 12.26.56 PM.png |
424 kB |
Les Cottrell |
Sep 16, 2020 12:27 |
Sep 16, 2020 12:27 |
|
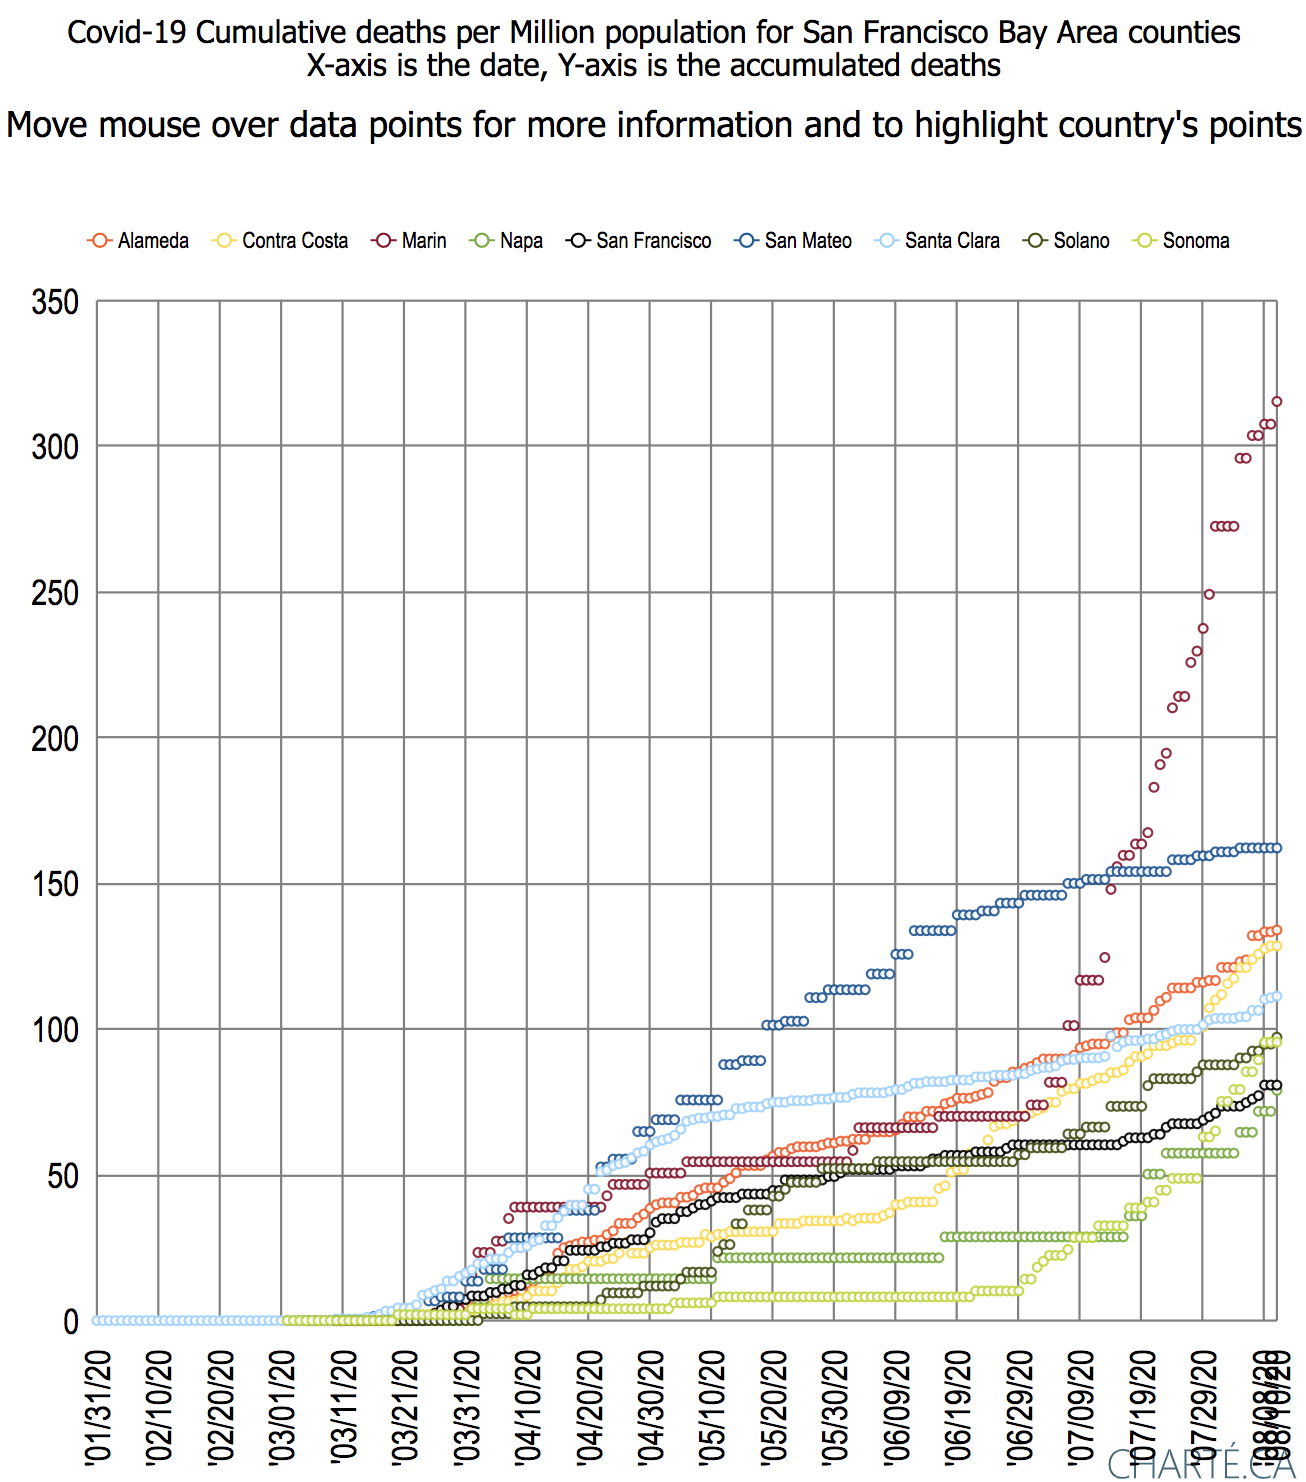
Page: Covid-19 US deaths by states
|
|
PNG File Screen Shot 2022-04-08 at 8.48.17 PM.png |
424 kB |
Les Cottrell |
Apr 08, 2022 20:48 |
Apr 08, 2022 20:48 |
|
Page: Impact of the Russo Ukraine war on ping response times
|
|
PNG File Screen Shot 2020-03-25 at 12.19.09 PM.png |
424 kB |
Les Cottrell |
Mar 25, 2020 12:23 |
Mar 25, 2020 12:23 |
|
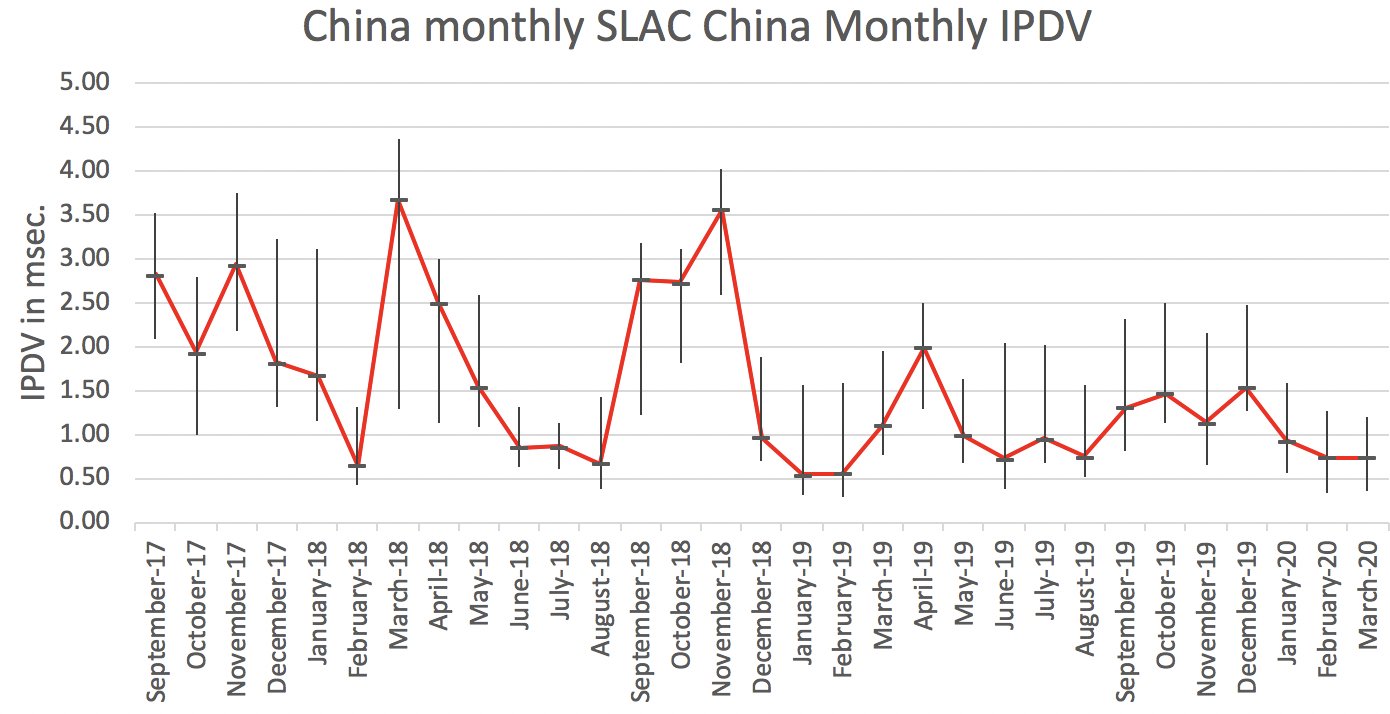
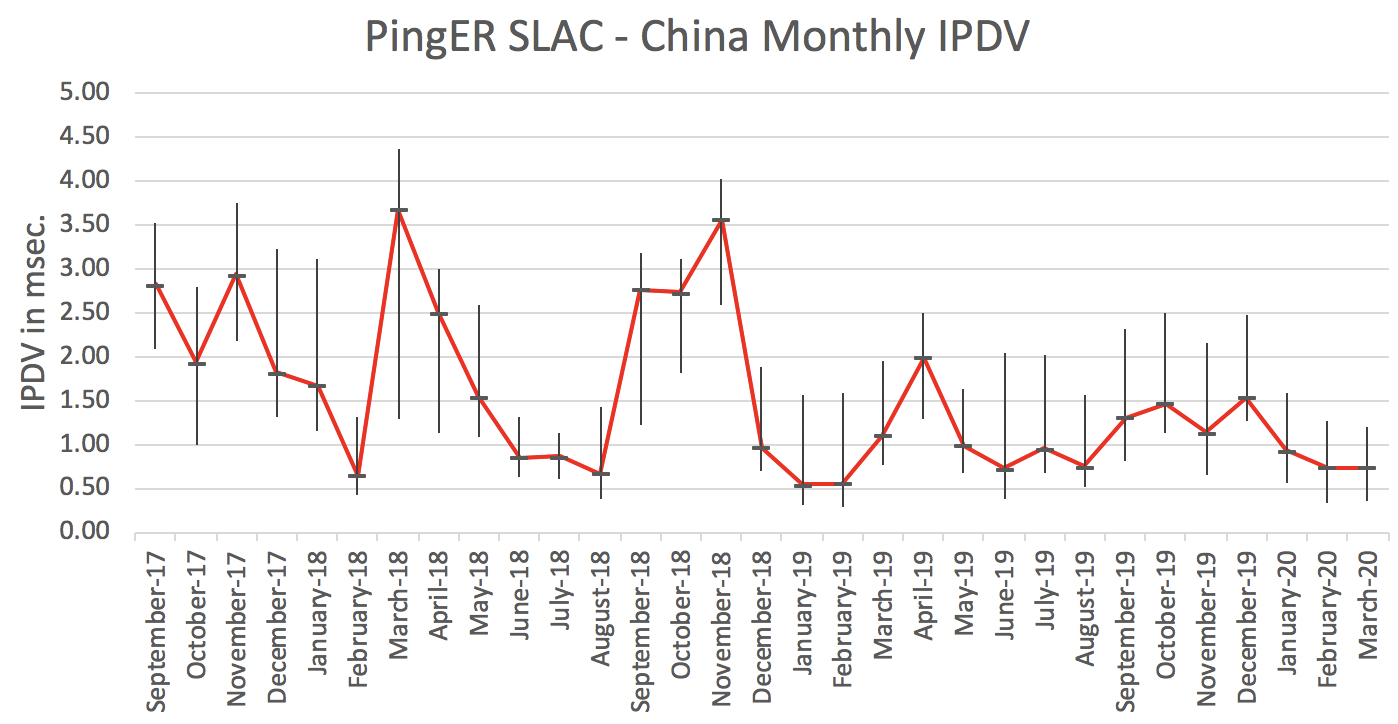
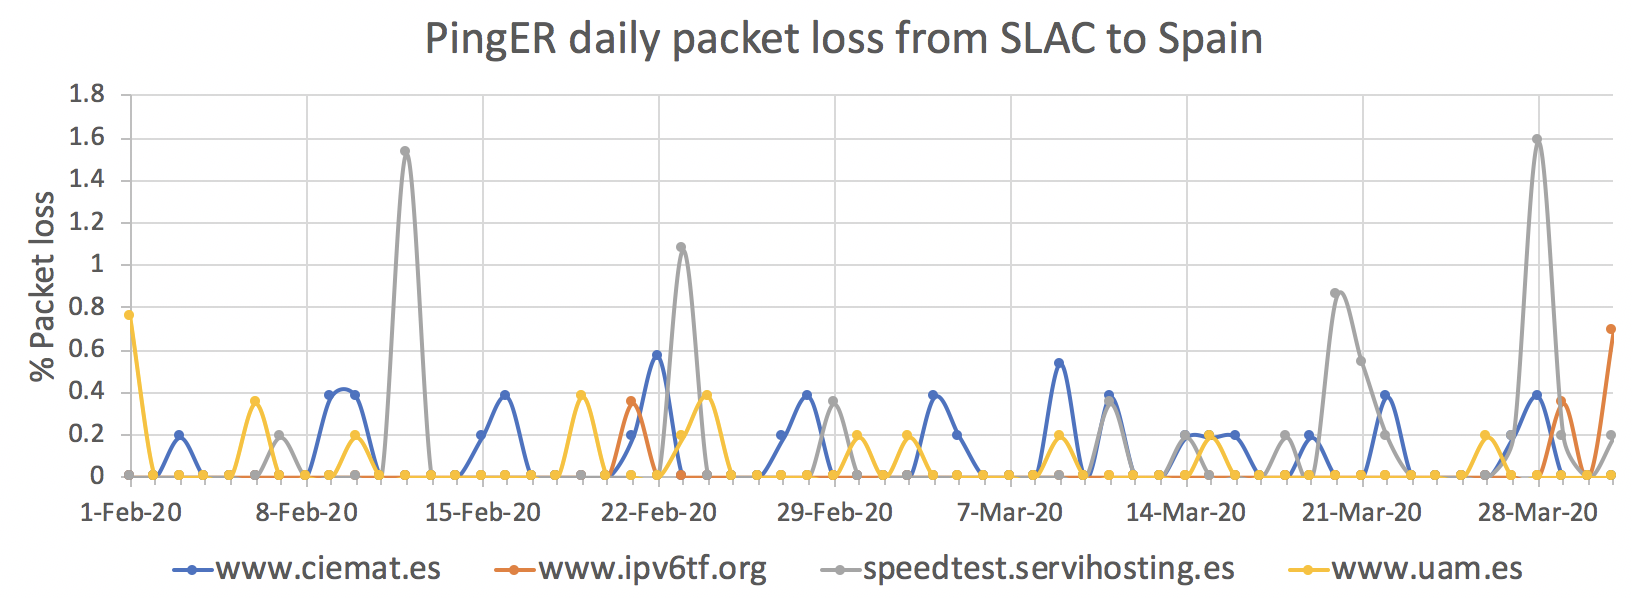
Page: PingER and COVID-19
|
|
PNG File Screen Shot 2020-11-20 at 3.38.57 PM.png |
424 kB |
Les Cottrell |
Nov 20, 2020 15:42 |
Nov 20, 2020 15:42 |
|
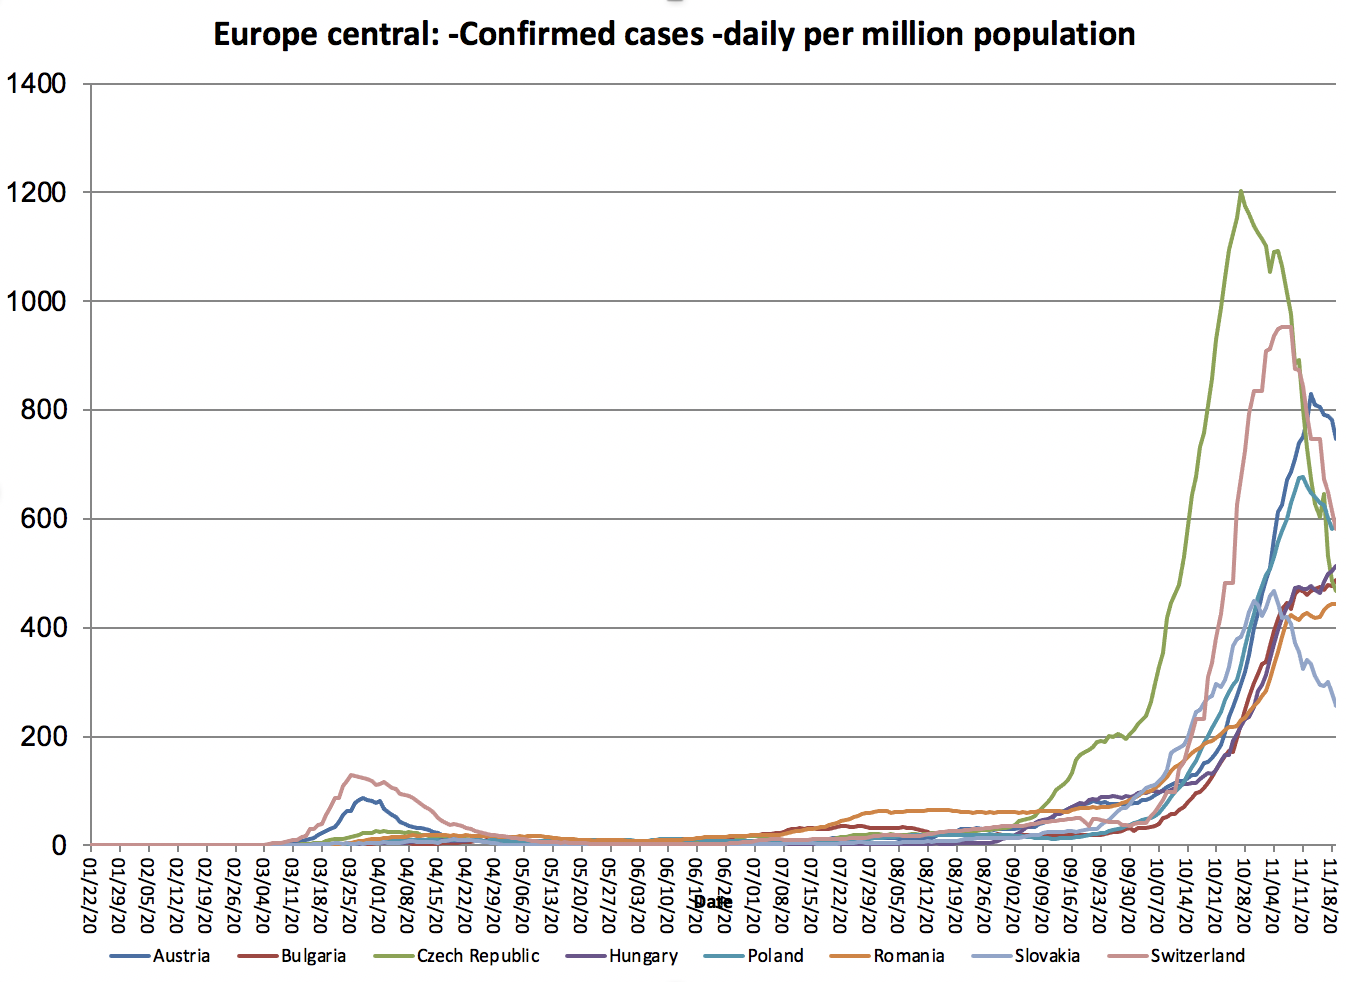
Page: Covid-19 comparisons by region
|
|
PNG File Screen Shot 2021-03-27 at 3.04.02 PM.png |
423 kB |
Les Cottrell |
Mar 27, 2021 15:04 |
Mar 27, 2021 15:04 |
|
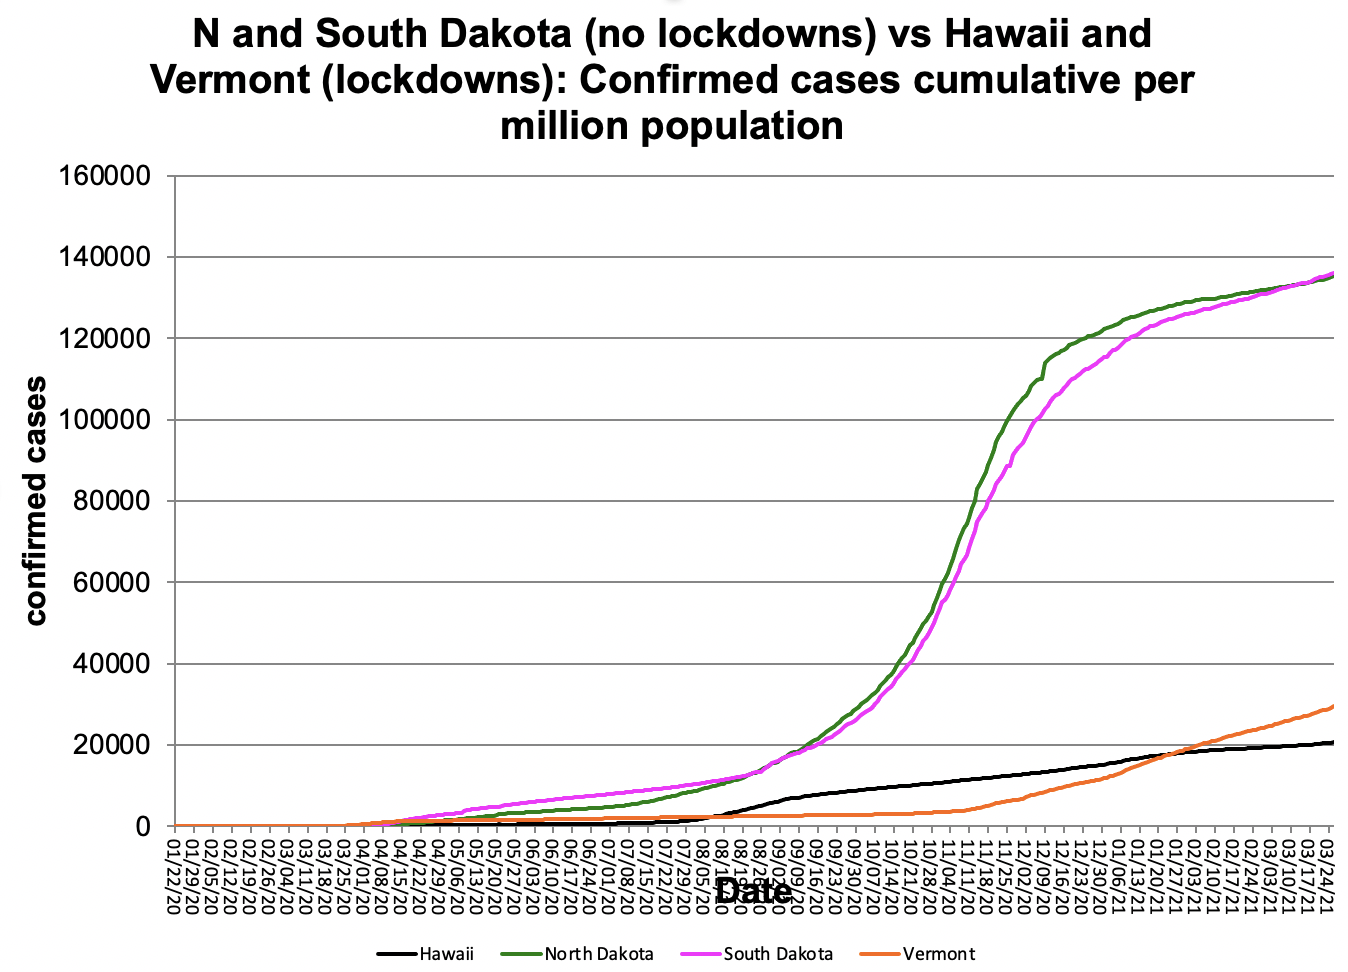
Page: Covid-19 California and New York (lockdowns) vs Florida and Texas(no lockdowns)
|
|
PNG File Screen Shot 2020-03-25 at 12.30.52 PM.png |
423 kB |
Les Cottrell |
Mar 25, 2020 12:31 |
Mar 25, 2020 12:31 |
|
Page: PingER and COVID-19
|
|
PNG File Screen Shot 2020-11-20 at 1.12.48 PM.png |
422 kB |
Les Cottrell |
Nov 20, 2020 13:14 |
Nov 20, 2020 13:14 |
|
Page: Covid-19 comparisons by region
|
|
PNG File Screen Shot 2020-11-07 at 7.29.33 PM.png |
422 kB |
Les Cottrell |
Nov 07, 2020 19:30 |
Nov 07, 2020 19:30 |
|
Page: Covid-19 US cases by political leaning
|
|
PNG File Screen Shot 2020-11-23 at 1.55.34 PM.png |
422 kB |
Les Cottrell |
Nov 23, 2020 13:59 |
Nov 23, 2020 13:59 |
|
Page: Covid-19 comparisons by region
|
|
PNG File Screen Shot 2020-11-20 at 1.21.20 PM.png |
422 kB |
Les Cottrell |
Nov 20, 2020 13:22 |
Nov 20, 2020 13:22 |
|
Page: Covid-19 comparisons by region
|
|
Microsoft Powerpoint 97 Slideshow network-jul12.ppt |
422 kB |
Les Cottrell |
Aug 10, 2012 07:48 |
Aug 10, 2012 07:48 |
|
Page: Papers and Presentations
|
|
PNG File image2014-4-22 14:46:1.png |
421 kB |
Les Cottrell |
Apr 22, 2014 14:46 |
Apr 22, 2014 14:46 |
|
Page: Visual Traceroute (VTrace)
|
|
PNG File image2014-4-22 14:49:58.png |
421 kB |
Les Cottrell |
Apr 22, 2014 14:49 |
Apr 22, 2014 14:49 |
|
Page: Visual Traceroute (VTrace)
|
|
PNG File Screen Shot 2020-04-01 at 5.32.53 PM.png |
421 kB |
Les Cottrell |
Apr 01, 2020 17:33 |
Apr 01, 2020 17:33 |
|
Page: PingER and COVID-19
|
|
PNG File Screen Shot 2021-01-26 at 10.23.45 PM.png |
421 kB |
Les Cottrell |
Jan 26, 2021 22:24 |
Jan 26, 2021 22:24 |
|
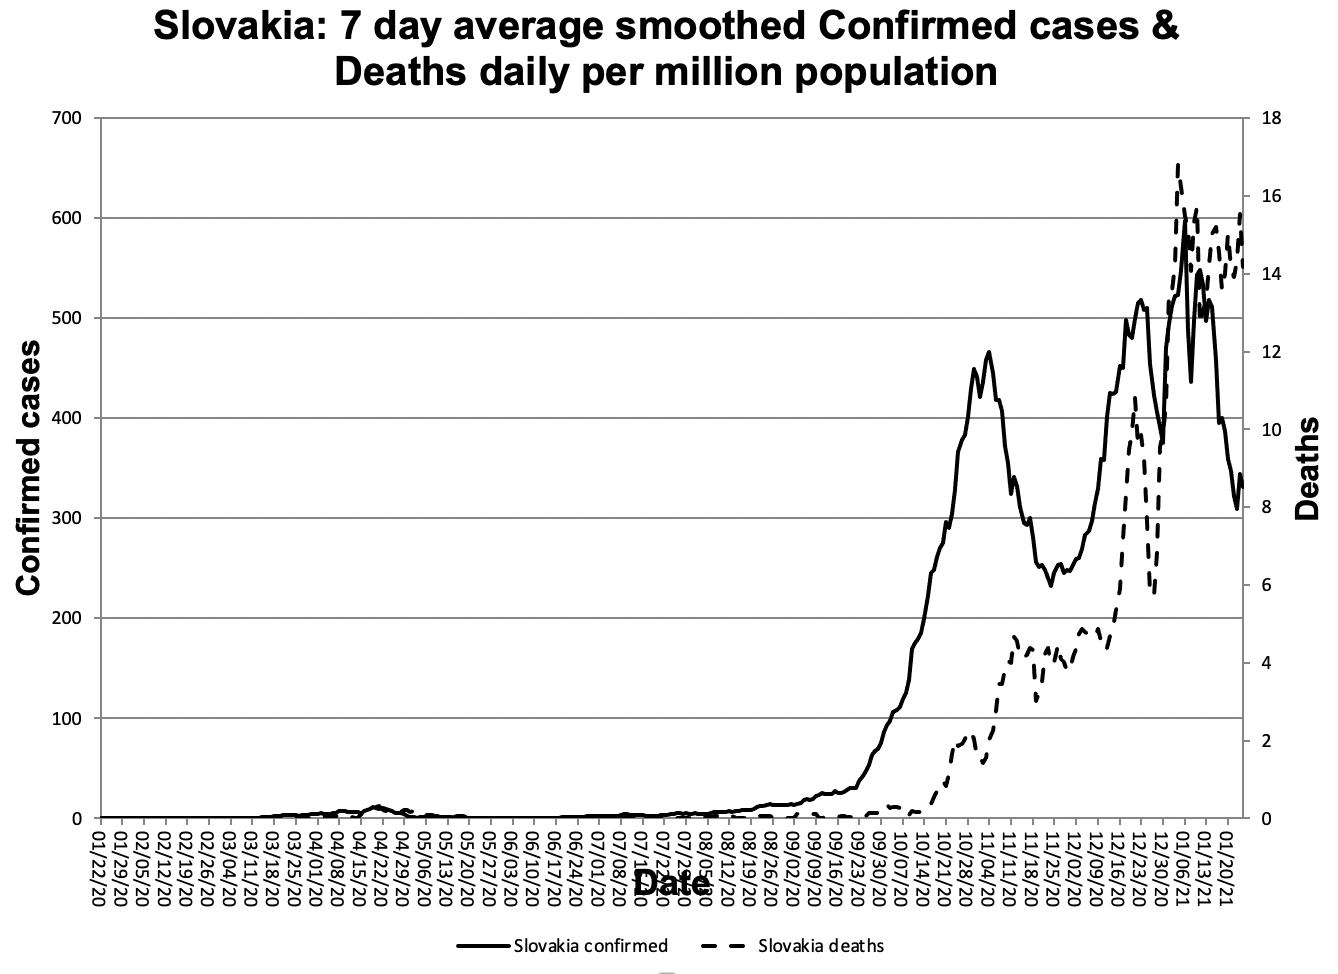
Page: Covid-19 Comparing the ratio of Deaths to Confirmed cases for representative countries
|
|
PNG File Screen Shot 2021-01-26 at 10.23.45 PM.png |
421 kB |
Les Cottrell |
Jan 30, 2021 13:31 |
Jan 30, 2021 13:31 |
|
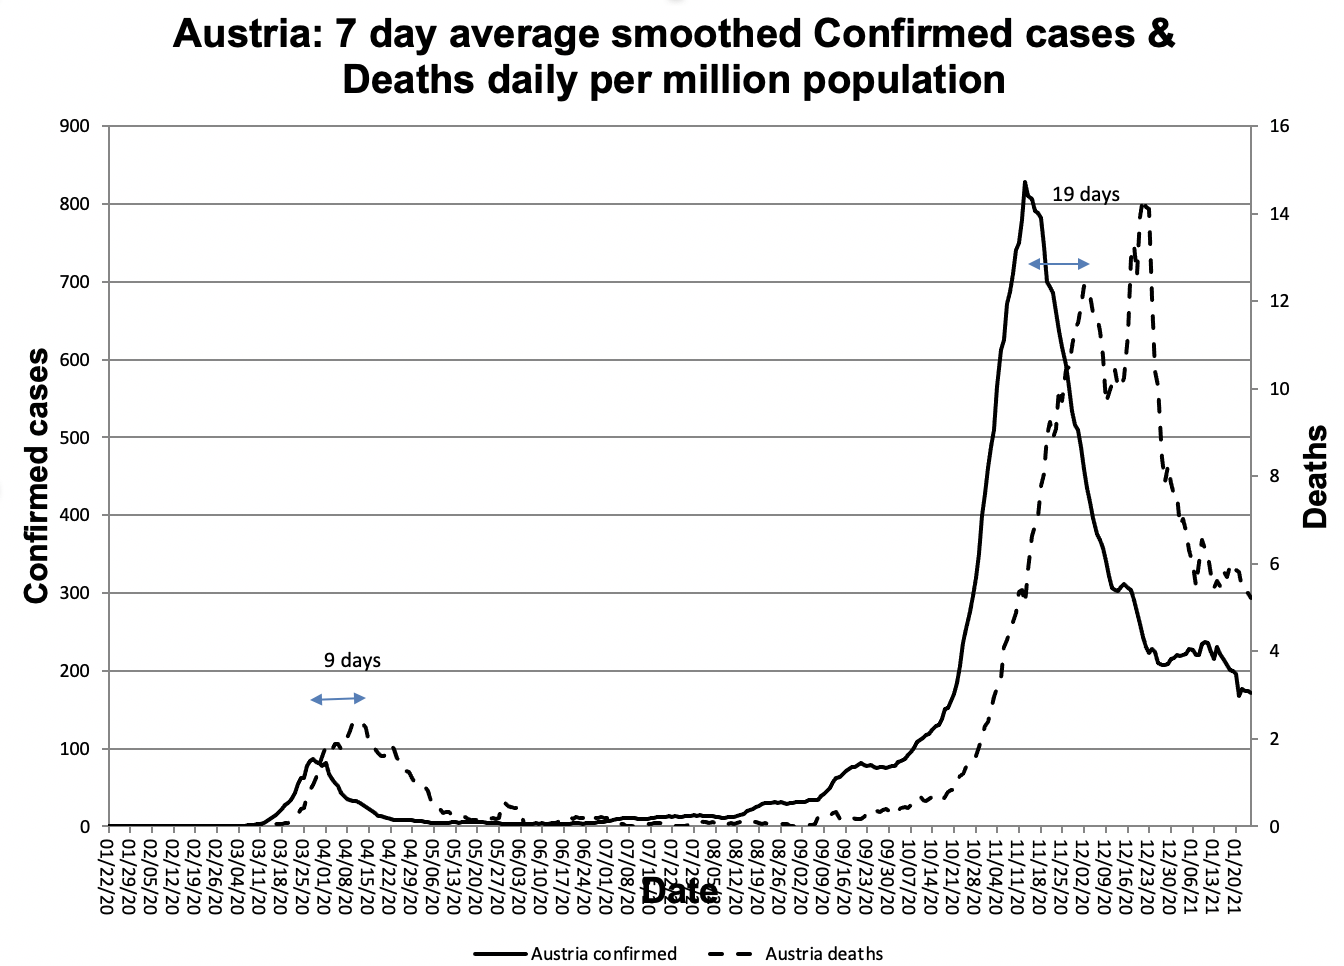
Page: Covid-19 Estimating delays between confirmed cases and deaths
|
|
PNG File Screen Shot 2021-01-26 at 9.54.31 PM.png |
421 kB |
Les Cottrell |
Jan 26, 2021 21:56 |
Jan 26, 2021 21:56 |
|
Page: Covid-19 Comparing the ratio of Deaths to Confirmed cases for representative countries
|