Task of the Data Processing on-call expert
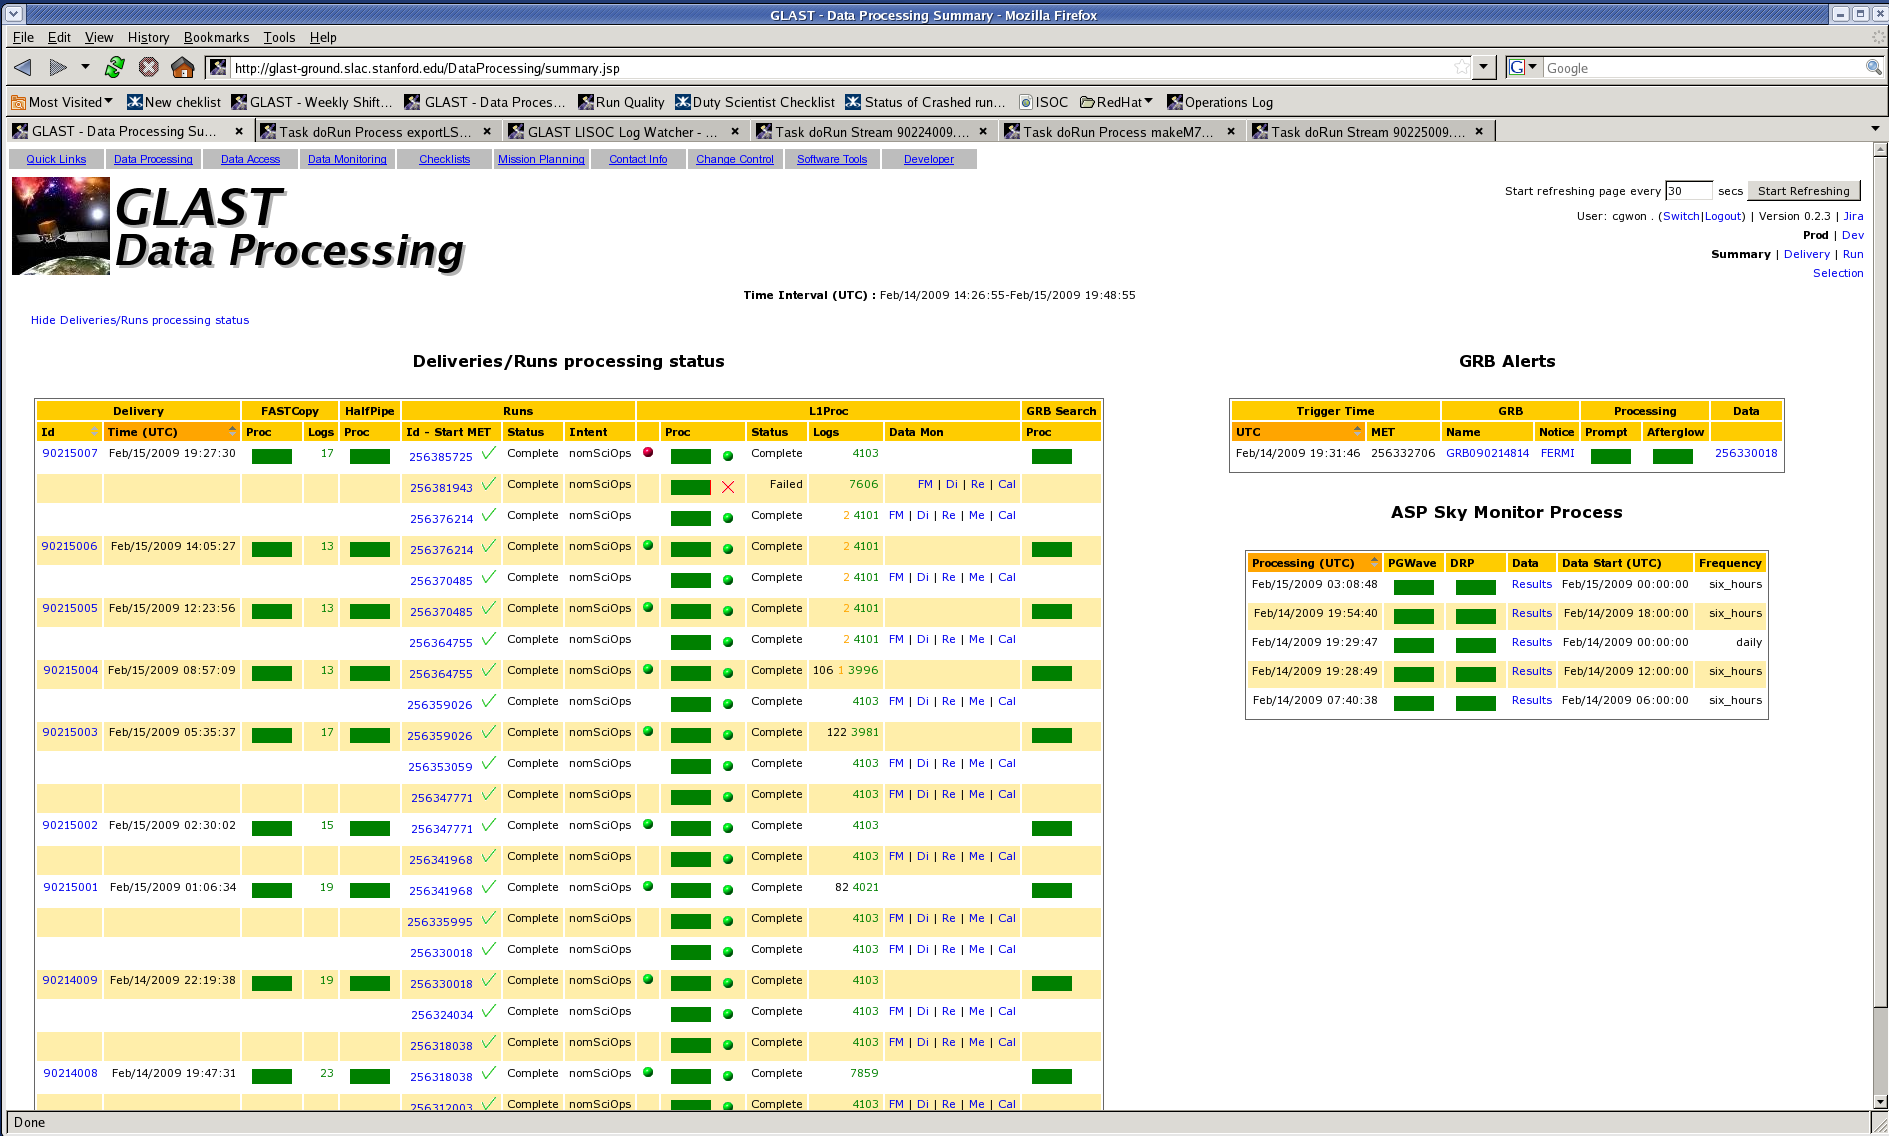
Monitor L1Proc and halfPipe: Every time a red cross appears on the Data Processing page, next to the L1Proc or halfPipe processing status bar, try to resolve the failure. We are not on-call for ASP/GRB search (Jim Chiang (jchiang{at}slac) should be emailed (not paged) for these failures) and we are definitely NOT on-call for infrastructure problems (can't see monitoring plots, etc.). If you get paged for something that is not under your responsibility, don't try to fix it: forward the message to the appropriate people and report everything in the Ops Log.
Familiarize yourself with understanding the Pipeline-II page by reading through the Pipeline-II User's Guide. It is a good starting point for understanding the general organization of the pipeline and the tools needed to track down problems.
It may be good to look at the task chart to see the interdependencies of tasks ("tasks" defined in Pipeline-II User's Guide). "Success" dependency means that a process needs to successfully complete in order for the dependent process to continue, while "All Done" means that even failed processes will result in the dependent process continuing.
Watch the Usage Plots and look for L1Proc/HalfPipe related tasks (doChunk, doCrumb, etc). Default rule of thumb of time is to use last 2 hours, because more than that will not give enough fidelity in the plot. If you see a series of points that make a flat line for an extended period of time, it may indicate problems with the pipeline.
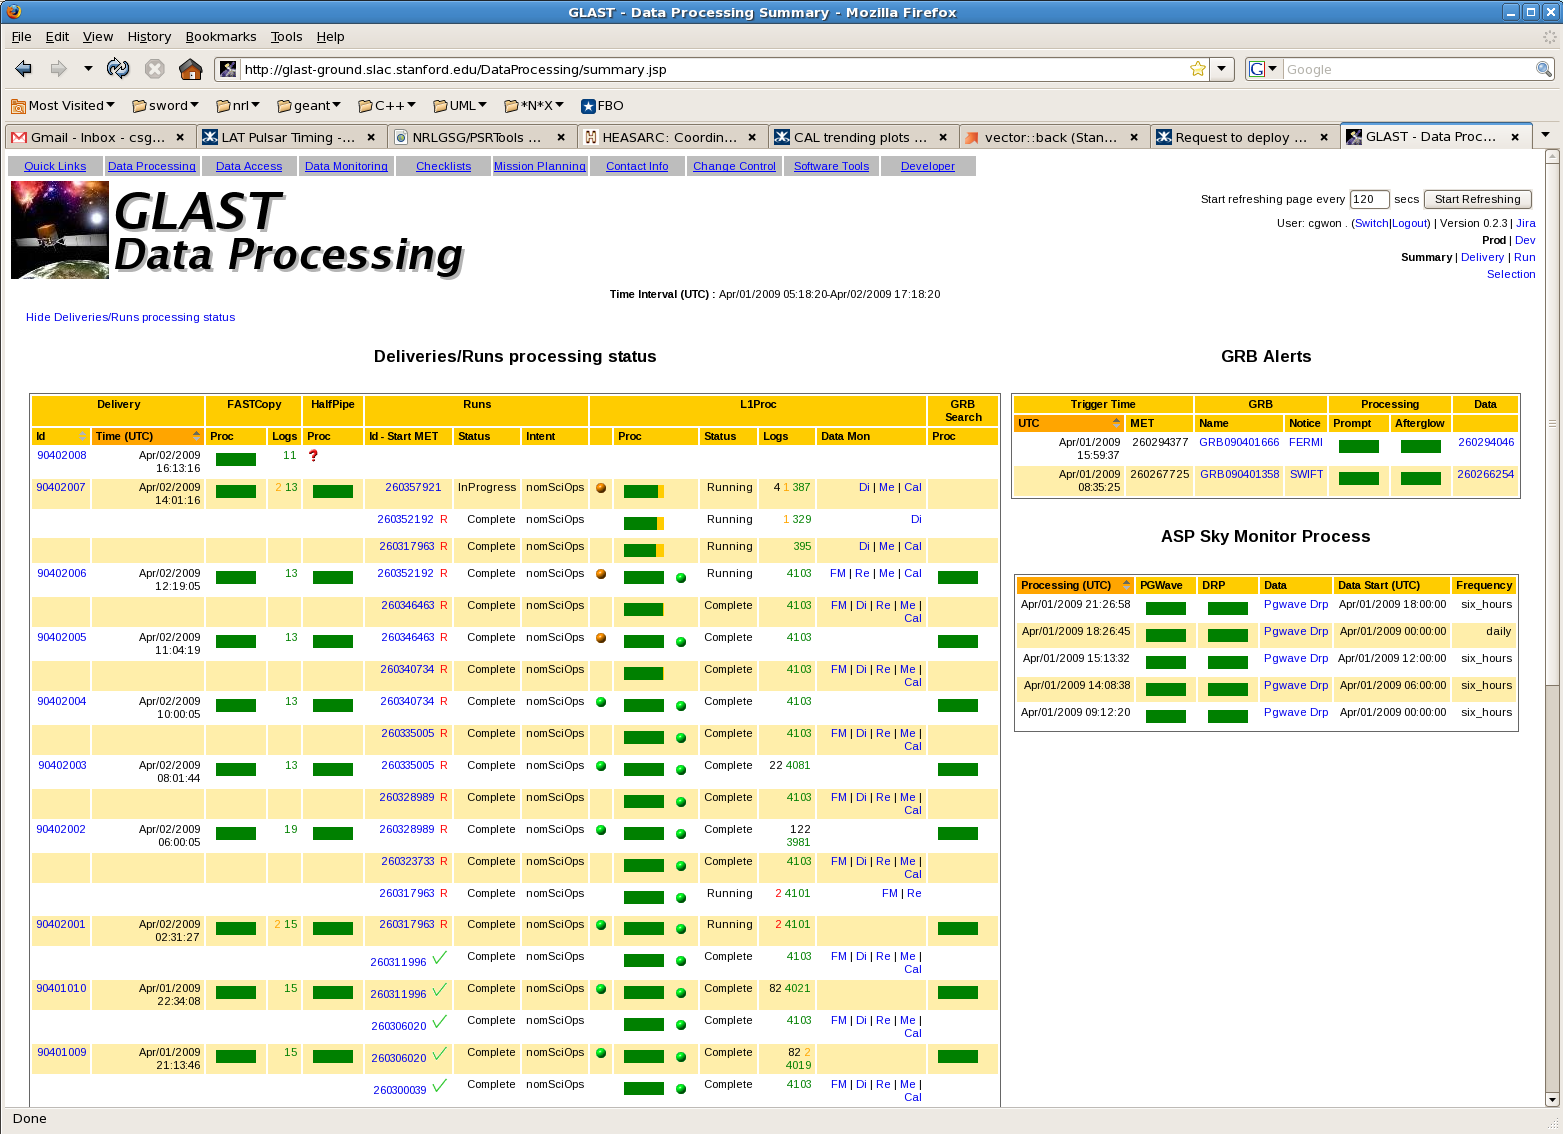
Data Organization
There are four main categories of data organization. At the top, there is the "Delivery", which is the data that is sent down from GLAST. Completely unrelated are the "Runs", which are time-segments determined by GLAST. A delivery can consist of a part of a run, many runs, or pieces of runs - there is no particular order that is guaranteed within a delivery with regards to a run. Runs (or parts of the run contained in a delivery) are broken into "Chunks", which are always contiguous blocks of data. Chunks are further broken down into "Crumbs", which are also contiguous.
When looking at files or directories, run numbers are typically prefixed by an "r", chunk numbers with an "e", and crumb numbers with a "b".
Different types of failures
There are 3 main type of failures, and should be handled differently.
Transient failures
- afs hiccup (can't read from/write to a resource located on an afs disk)
- nfs hiccup (can't read from/write to a resource located on an nfs disk)
- LSF hiccup (an lsf batch machine crashes or is rebooted)
- lost Data Base connection : MOOT, Calibration database log, or more rarely on Oracle
- recon segfaults for no apparent reason (nothing in logfile)
- Pipeline deadlock
How to recognize transient failures: they usually affect only one single job (disk or DB failures), or a small number of jobs all on the same machine (LFS failure). If a process complains about a missing file but the file exists, or gets a read error after opening a file, it's probably a disk server hiccup. If the log file ends suddenly, without the usual LSF postlog, the batch host probably crashed. There will probably be several jobs failing the same way at the same time.
What to do in case of transient failures: rollback the affected process(es) when possible (see below for the rollback procedure). Look for the dontCleanUp file and check the Log Watcher (see below). If recon segfaults for no apparent reason, email Heather and Anders before the rollback, including a link to the log file, which will tell them where the core file is. For pipeline deadlocks, email Dan and include a link to the process instance.
Transient failures are rare lately. For the last couple of months, most failed processes are automatically retried once. This usually fixes transient issues, so usually when there's a failure it indicates an actual problem.
Bad merges: If a process that's merging crumb-level files into chunks or chunks into runs can't find all of its input files, it won't fail. See the "dontCleanUp" section below. Processes downstream of such a merge may fail because they are trying to use different types of input files (e.g., digi and recon) and the events don't match up because some are missing from one file and not the other. Then you need to roll back the merge even though it "succeeded" the first time.
Infrastructure failures
- single batch host is killing several jobs ('rogue' LSF host)
- group of batch hosts crashed or went offline
- afs crashed on one of the host machines
- scratch disk is full on one or more of the host machines - see what to do here
A staging disk is full (these are accessed from /afs/slac.stanford.edu/g/glast/ground/PipelineStaging[1-7])
- /nfs/farm/g/glast/u52 or /nfs/farm/g/glast/u15 is full
How to recognize infrastructure failures: they usually affect a large number of jobs, either on the same LSF host or on different LSF hosts.
What to do in case of infrastructure failures: these failures involve a large number of people to be taken care of (the infrastructure expert on-call and often also the SCCS), so for the time being still page Warren and/or Maria Elena (see L1 shift schedule) if you think that one of those failures might be happening during the night (if in doubt, page anyways).
Permanent failures
- G4 propagator error. If recon dies complaining about g4propagator, we can't fix it. If this happens, email Heather (heather625{at}gmail) and Anders (borgland{at}slac) (and possibly Warren (focke{at}slac) and Maria Elena (monzani{at}slac)). Include a link to the log file, which will tell them where the core file is.
- Overlapping chunks. If findChunks complains about overlapping chunks, tell Bryson; if trending merges complain, tell Bryson and datamonlist@glast2.Stanford.EDU. Rollback won't help.
- Deliveries arriving too closely will mangle the display. The underlying processes are fine, but email obsproblist{at}glast2.stanford.edu, Jim (jchiang{at}slac) or Bryson (blee{at}slac) to fix the display.
How to recognize permanent failures: besides those 2 cases, everything that doesn't get fixed after a rollback is by definition a permanent failure.
What to do in case of permanent failures: contact the appropriate people above, if you are sure you know what happened. Otherwise, page Warren and/or Maria Elena (see L1 shift schedule). If there is another part of the run waiting, the run lock (see below) will have to be removed by hand; page unless you're really sure of what you're doing.
Other failures
This is a comprised list of failures that don't really fit into the other major three ones
- Too few events in the run, or gaps - can lead to too few events in the magic7 file FT2 failure. Try to copy the /afs/slac/g/glast/ground/PipelineStaging6/halfPipe/XXX/magic7_XXX.txt (where XXX is the run number) to /afs/slac/g/glast/ground/PipelineStaging6/YYY/magic7_YYY.txt (where YYY is the run where fakeFT2 failed ... remember to change XXX to YYY on the magic7 file name). Then rollback fakeFT2. If this fails, email Andrea (tramacer{at}slac) for additional information regarding problems with FT2.
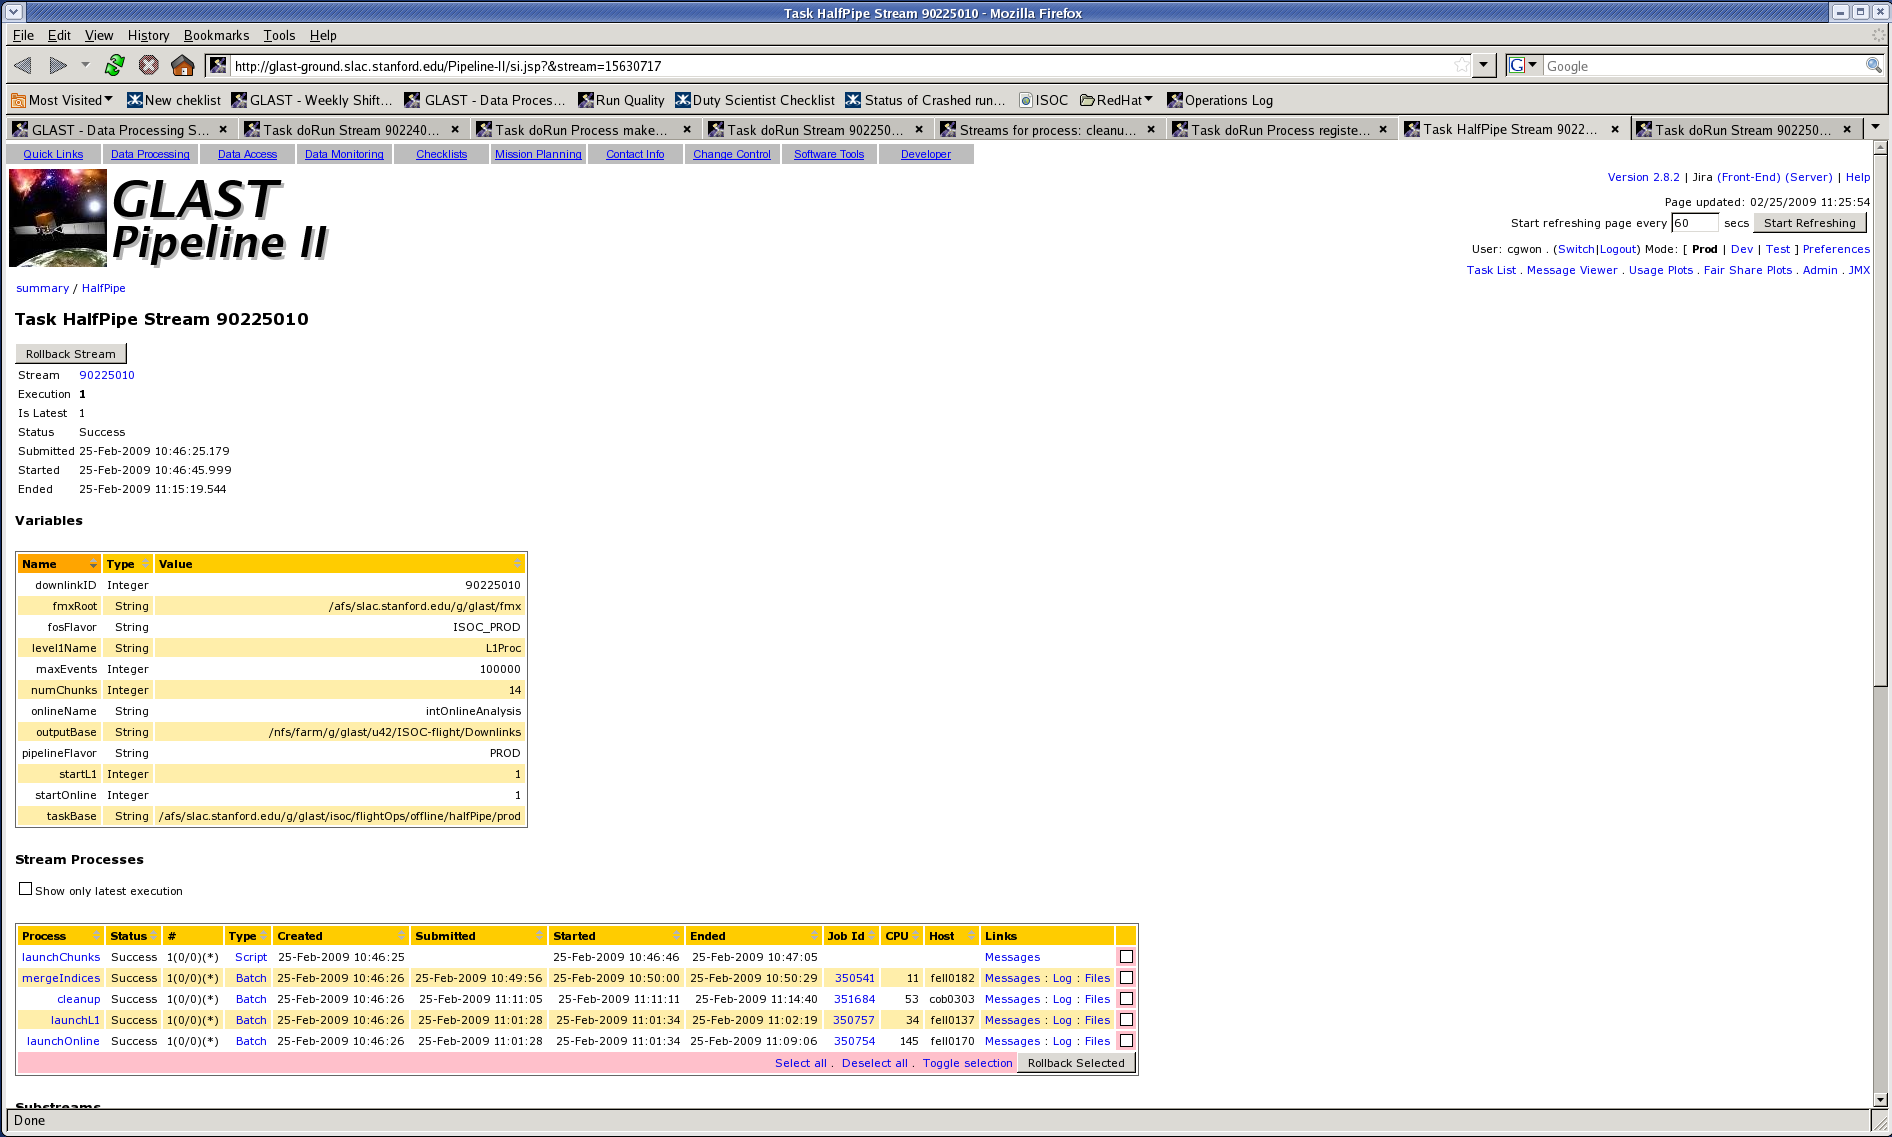
Everything to know about the Rollback
A rollback is essentially a restart of the stream or substream. It will re-run a particular process and all processes that depend on its output.
How to rollback
You can roll back from the pipeline front end. The entire stream can be rolled back by clicking "Rollback Stream" at the top, or individual streams in the main stream can be rolled back by selecting the pink boxes under "Stream Processes" and clicking "Rollback Selected".
But if multiple processes have failed (common), it's usually better to use the command line.
/afs/slac.stanford.edu/u/gl/glast/pipeline-II/prod/pipeline -m PROD rollbackStream --minimum 'L1Proc[80819007]'
This will roll back all of the failed, terminated, or cancelled processes in delivery 80819007. If you don't say --minimum, it will roll back the whole delivery. That's usually not what you want. Also note that it will not rollback processes that have succeeded, but with incomplete information (ie - problems arising from afs/nfs hiccups). Such processes may need to be rolled back via the front end.
After a rollback, the red x on the data processing page will be gone, but the L1 status will still say Failed. This tends to confuse the duty scientists. You might want to use the setL1Status task (see bellow) to make it say Running. This is really optional, it won't affect the processing in any way. But there will be fewer pagers beeping.
Removing "dontCleanUp" is not necessary to process the data. The file just stops temporary files from getting deleted when we're done with them.
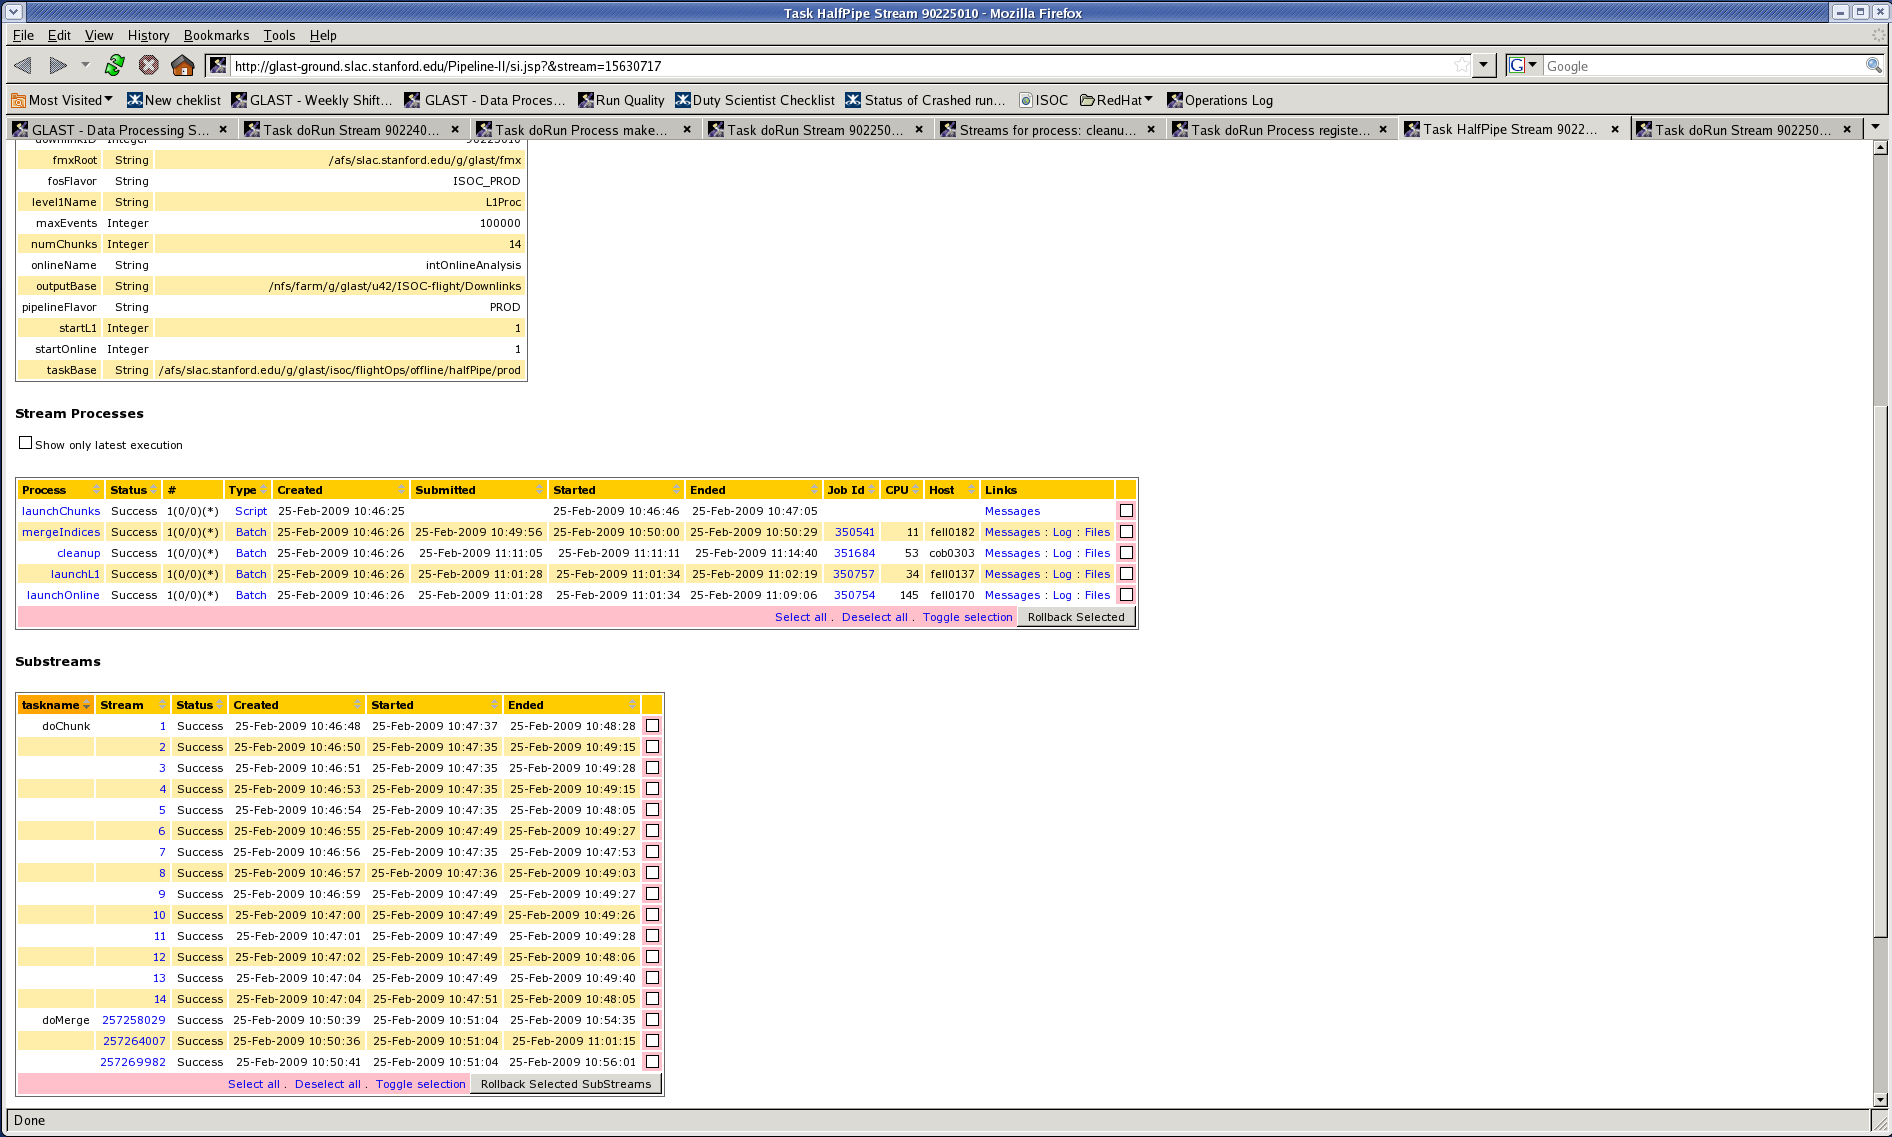
Rolling back substreams
From the front end, find the "Substreams" area and click the pink boxes for substreams that you want to roll back. Then click "Rollback Selected SubStreams".
From the command line it's a bit more tricky:
/afs/slac.stanford.edu/u/gl/glast/pipeline-II/prod/pipeline -m PROD rollbackStream --minimum 'L1Proc[90117001]/doRun[253889937]'
Remember to escape the square brackets if you are in tcsh.
When to rollback
Wait for the "setCrashed" stream to have run.
Rollback won't work unless everything downstream of the failed process is in a final state. It's generally not harmful to try too soon, you just get an unhelpful error message. Most things at run level can be rolled back right away. If a recon job fails, you'll have to wait at least an hour. Maybe half a day.
Notice that the GRB search is executed per delivery and depends on all the FT1 and FT2 files in each run to be registered (therefore, it depends on almost "everything" that belongs to that delivery). For this reason, you might need to wait for the entire delivery to be completed before being able to roll back any failed recon jobs. And because of the run lock (see below), some of the (parts of) runs in the delivery might have to wait for other deliveries to finish, which might have their own failures... It's possible, but rare, to get deadlocks, where nothing can proceed until a lock is removed by hand. Best to ask for help then.
In general, experience will tell you when you can roll back what. So, in doubt, you can try anyways (if it's too soon, nothing will happen and you will get an error)!
Often you can roll things back sooner if you cancel some processes. If there is a delivery with some runs that are ready to roll back and others that aren't, you can do the rollback if you cancel kludgeAsp. "/afs/slac.stanford.edu/u/gl/glast/pipeline-II/dev/pipeline -m PROD cancelProcessInstance 13388768" The number (or numbers, you can use a space-separated list to do more than one at a time) is the oracle PK for the process instance, it's in the URL for the process instance page in the frontend. This takes a long time, 10-30 minutes.
The dontCleanUp file
Any time one of the merges processes can't find all of its input files, a message is generated in the Log Watcher (and there will be errors in the log of the failed processes complaining about "Different number of events ...") and cleanup for the run is disabled by a file called dontCleanUp in the run directory on u52/L1. All cleanup jobs will fail if the dontCleanUp file is present. If everything is OK (see instructions below), that file can be removed and the jobs rolled back.
To check that everything is OK, follow these steps:
The new way:
- Look at the dontCleanUp file. It should contain a list of all merge processes that missed files, and what files were missing. I's possible that it will get garbled by multiple jobs writing to it at once, so if it doesn't seem to make sense, you can still get the information by following the steps below.
The old way:
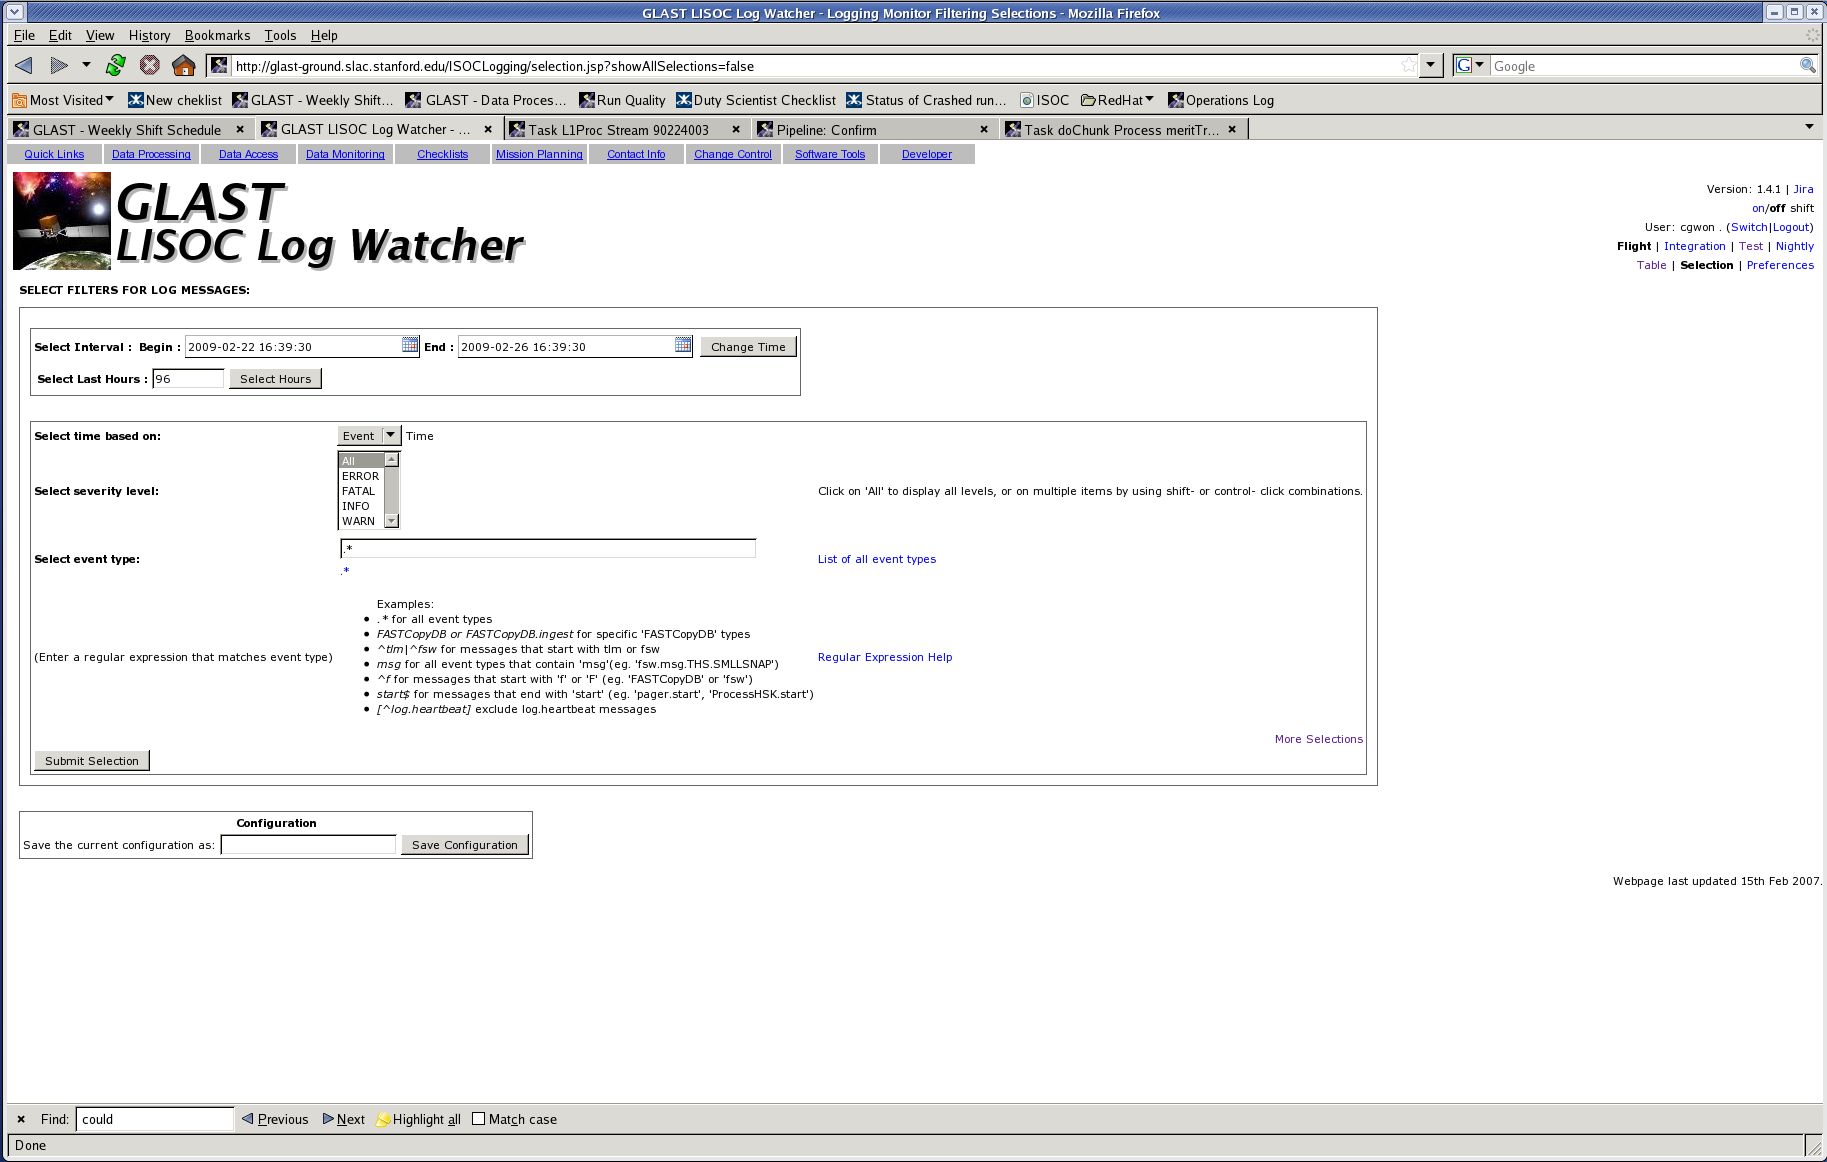
- From the glast-ground page, click "Logging" (about 1/3 of the way down left side)
- Click "Selection" (upper right) - page should look like this
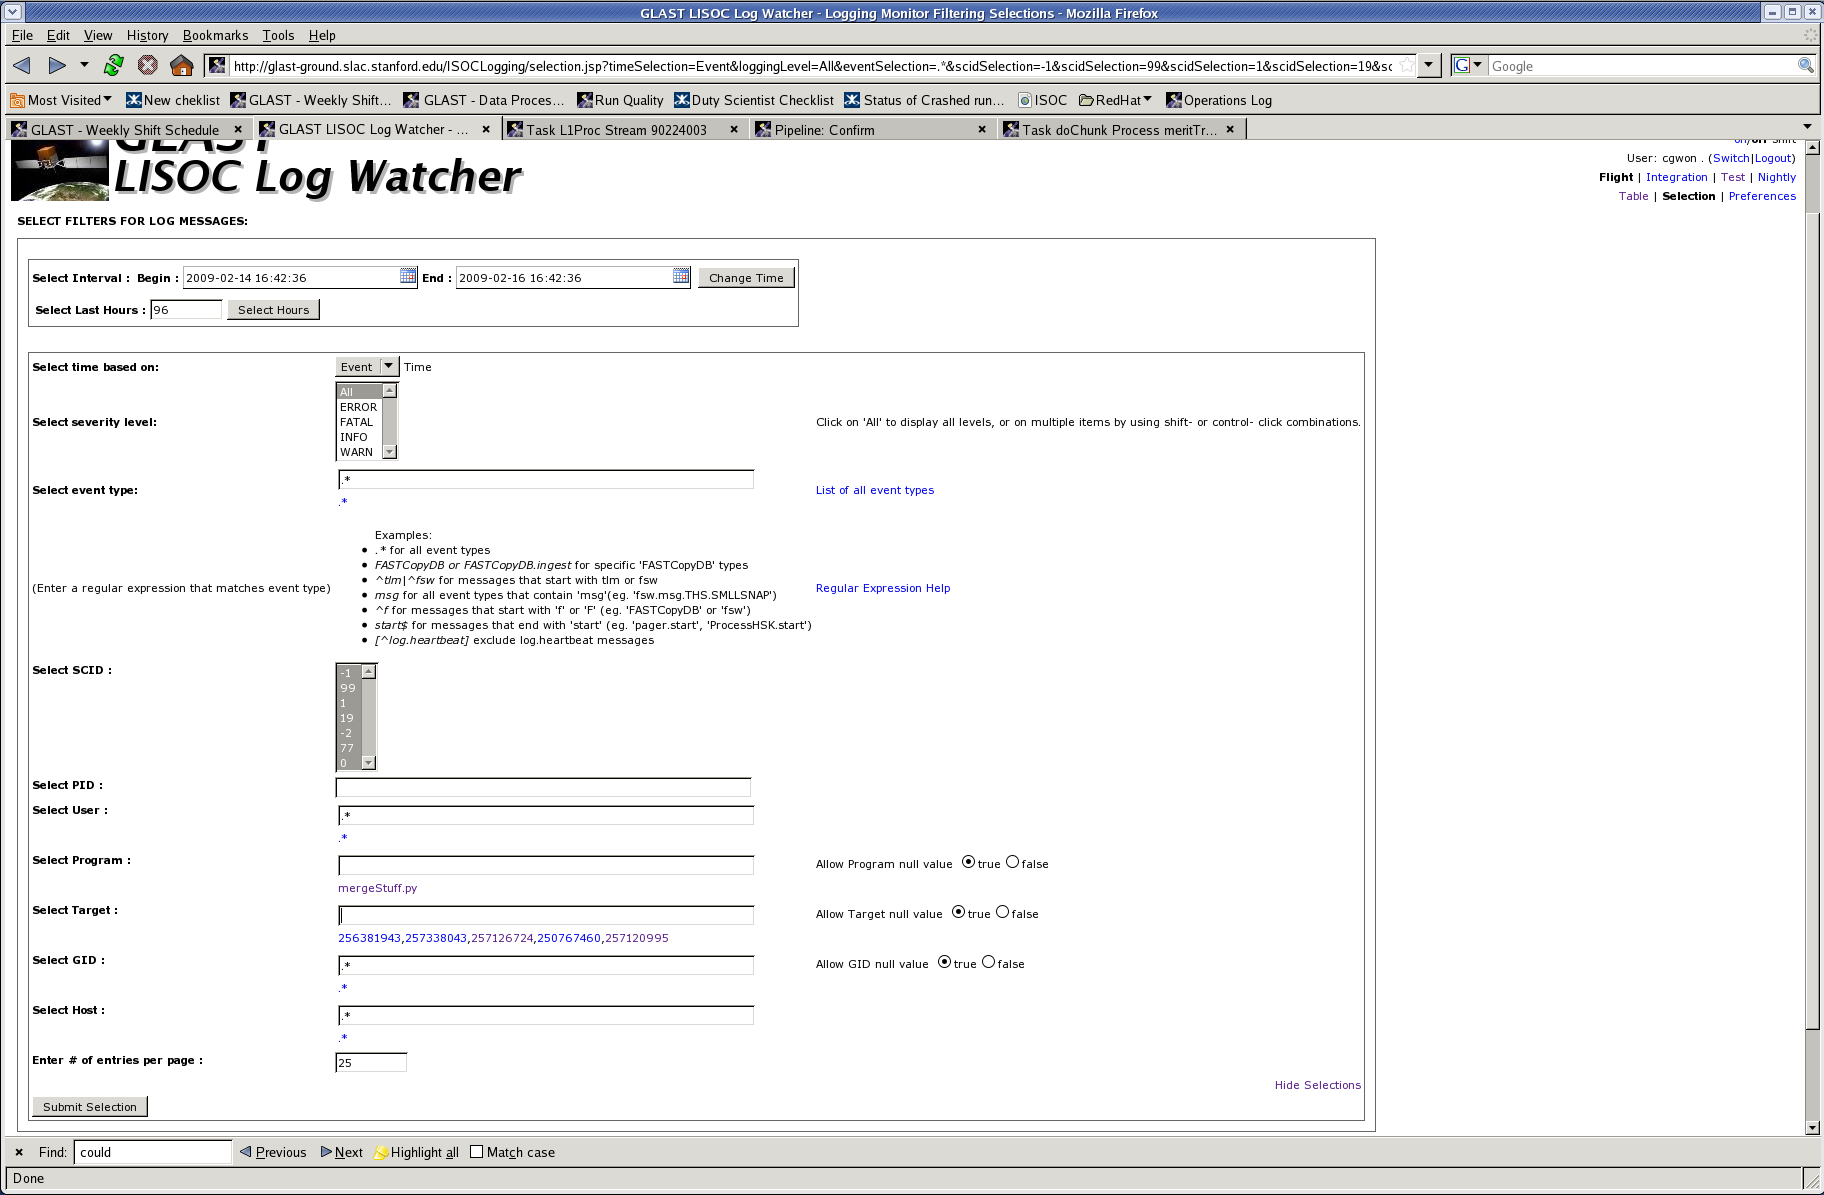
- Click "More Selections" (lower right) - page should look like this
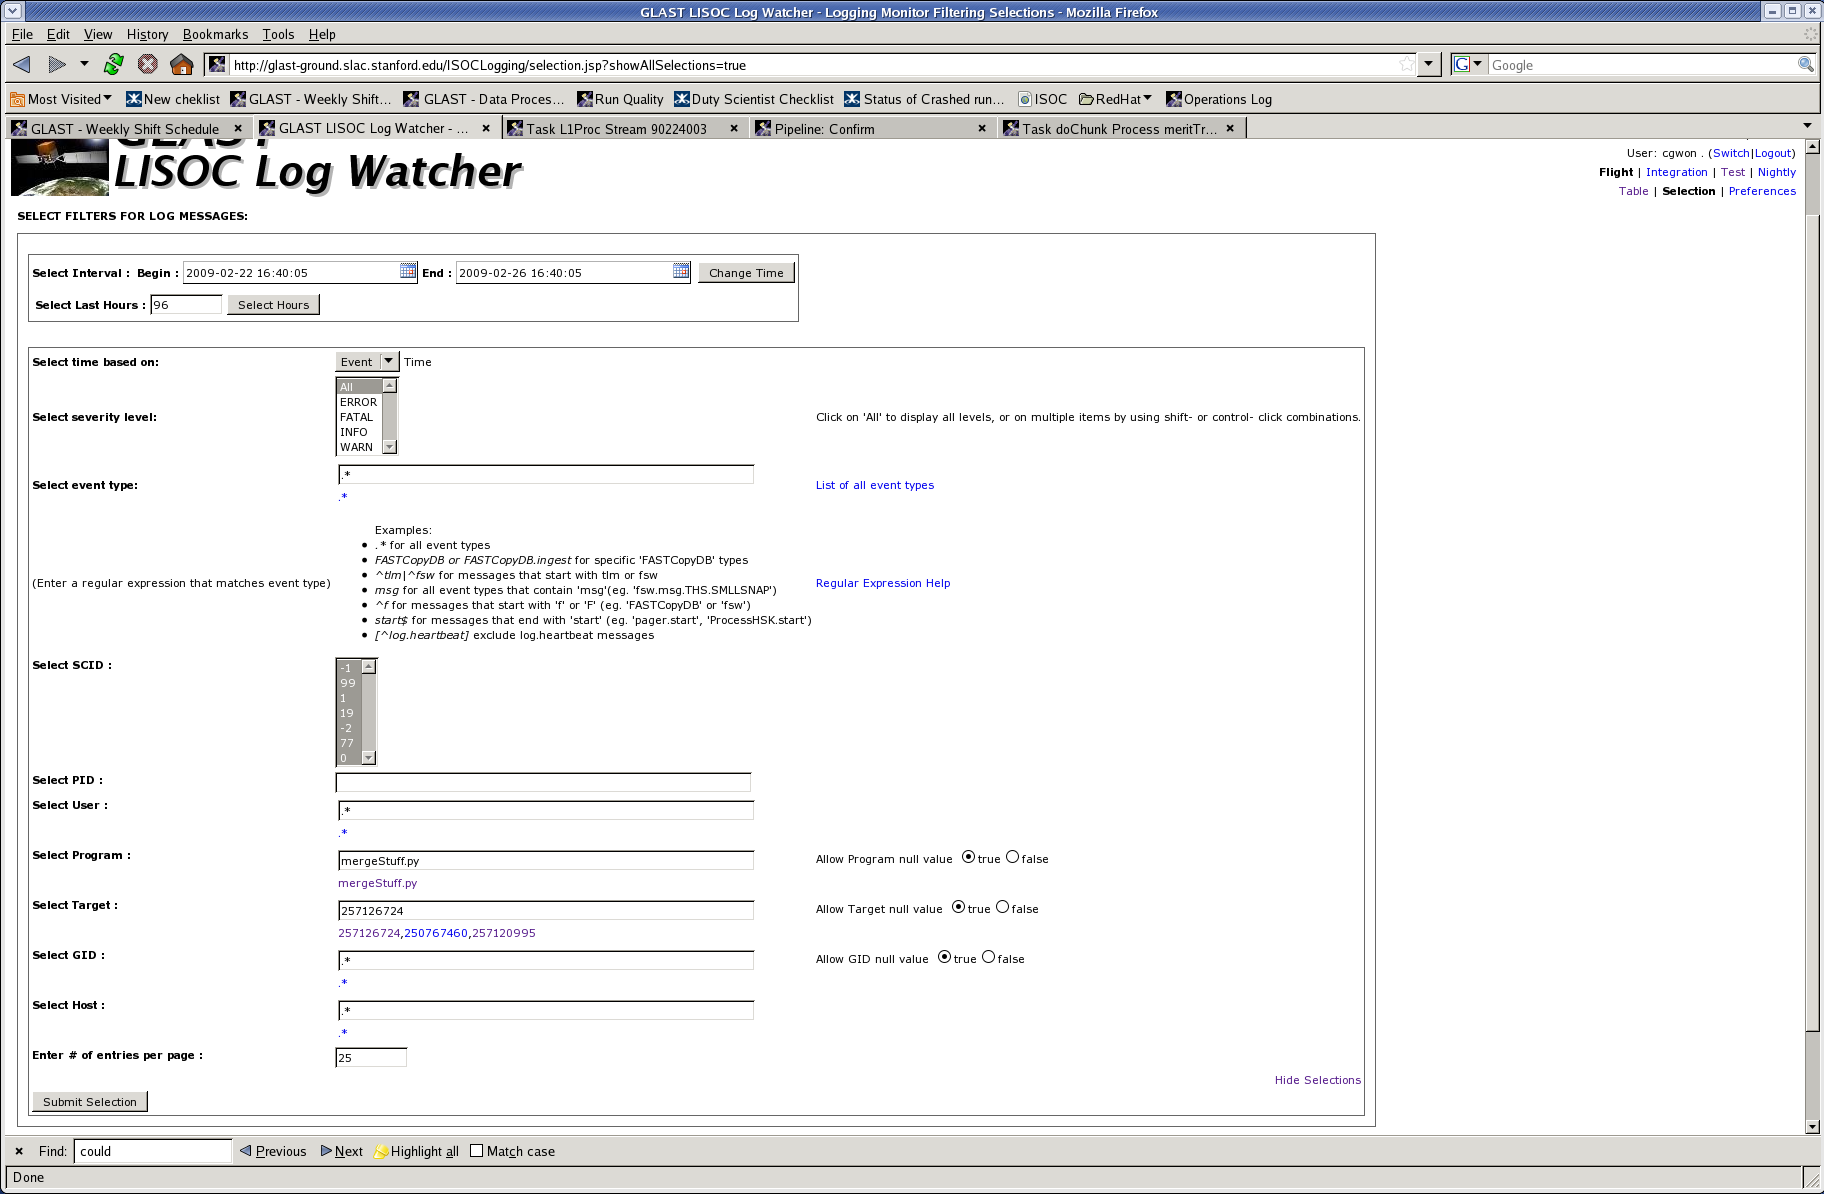
- In the "Select Program" field, enter "mergeStuff.py"
- In the "Select Target" field, enter the run number.
- Click "Submit Selection" - page should look like this after filling Program and Target fields and submitting
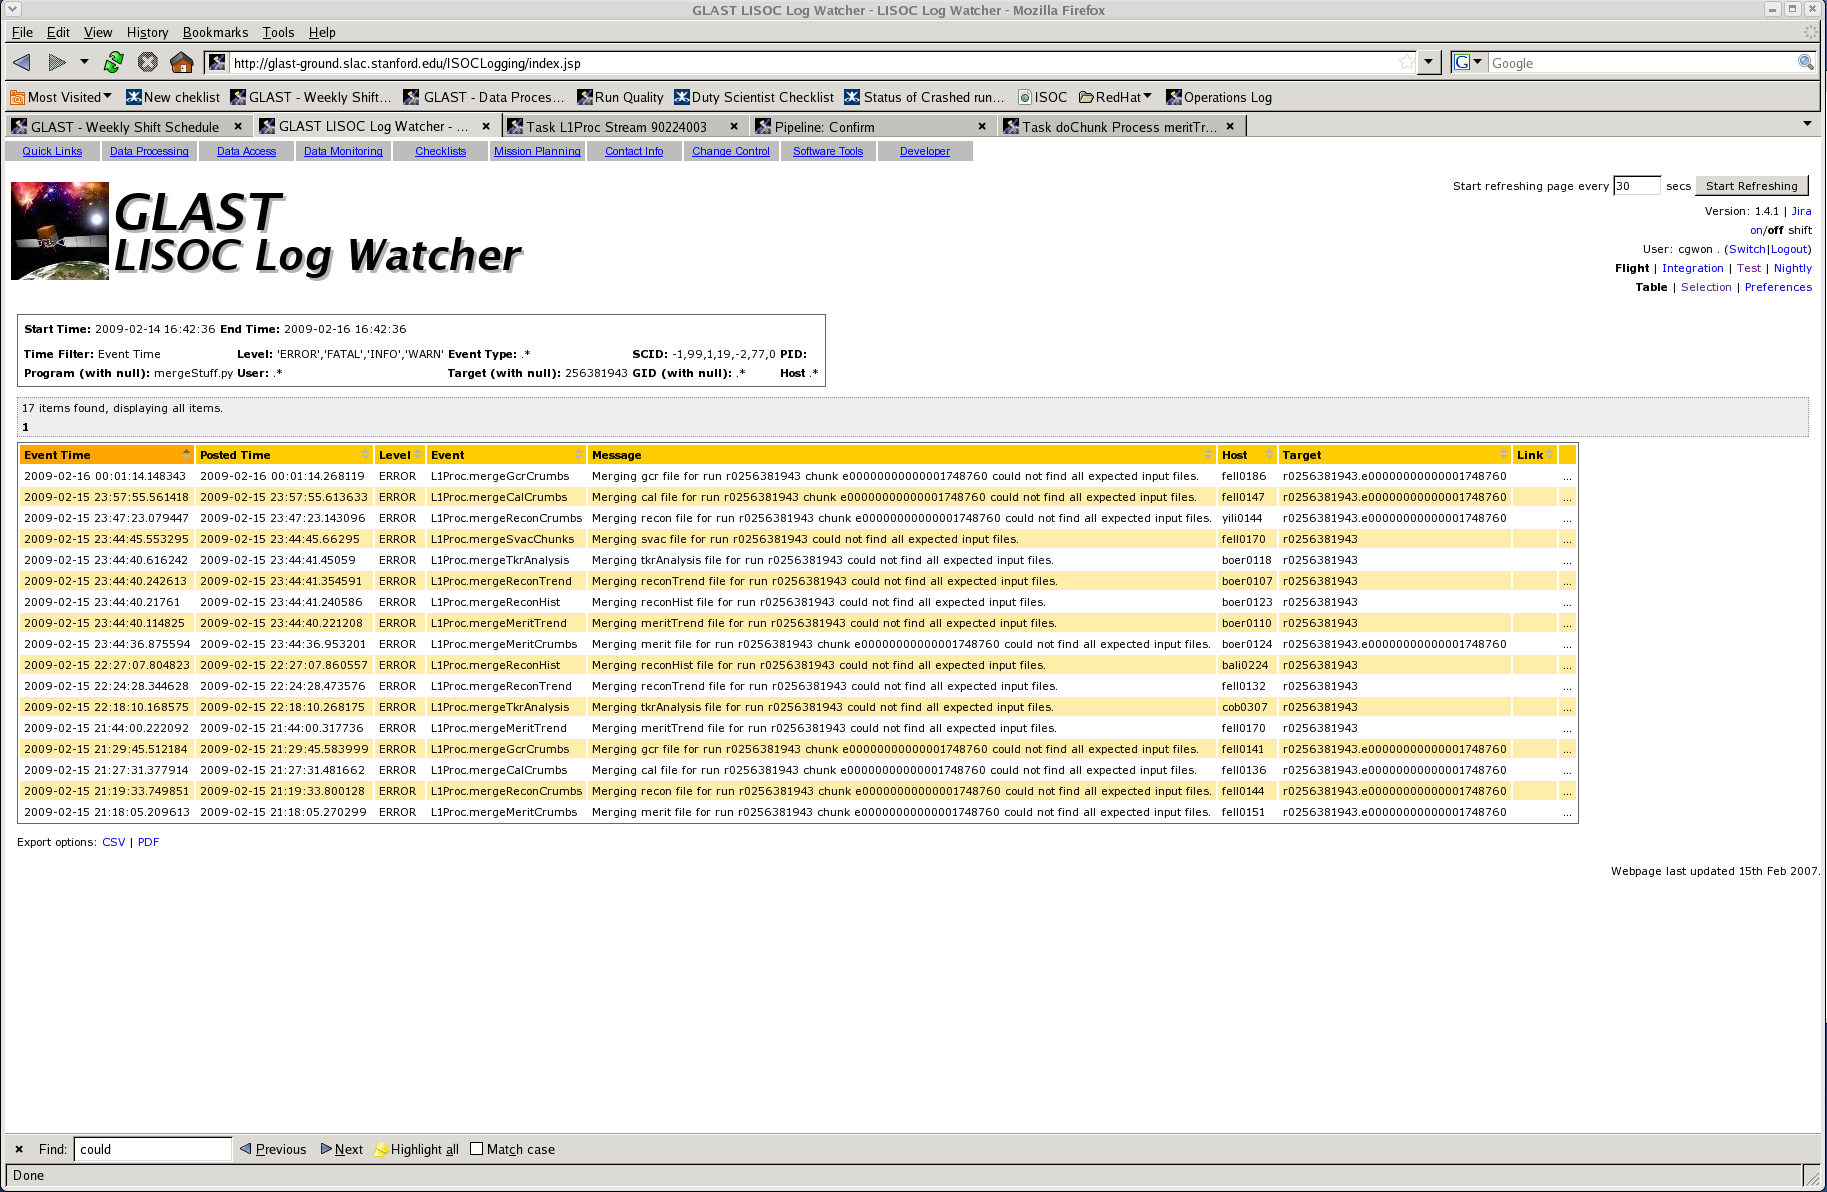
- Click "Table" (upper right, next to "Selection") - page should look like this
Now you should have a list of complaining about not being able to find input files. If any of the complaining merges are downstream of a failed process, you can ignore them. This is usually the case. But if they are not downstream from a failure, it means there was a disk read error while setting up the merge. Look at the logfile for that merge, it will say what files are missing. If they are really there, the merge can be rolled back and will probably work the second time. If they are not there, there's a bigger problem, and this should be considered a "permanent failure".
Any time one of these messages is generated, cleanup for the run is disabled by a file called dontCleanUp in the run directory on u52/L1. All cleanup jobs, and checkRun, will fail if that file is present. If everything is OK, that file can be removed and the jobs rolled back. The cleanupCrumbs jobs shouldn't fail if they're rolled back after cleanupChunks has run (they used to, but don't anymore).
The run lock
Only one delivery can process a run at a time. This is enforced by a lock file in the run directory on u52/L1. If findChunks fails or there are permanent failures in the run and another part of the run is waiting, it has to be removed by hand. It should never be removed unless the only failures in the run are findChunks or permanent ones, or there's a deadlock. Even then you have to wear a helmet and sign a waiver.
Too Much Data
Hopefully this whole section is now obsolete, see the next one.
Sometimes we get no data from the MOC for half a day and then it all arrives at once. This will overload the AFS buffers (see next section) unless L1 processing is throttled by hand (we are working on implementing an automatic throttle, and ditching AFS buffering in favor of xrootd). You do this by hand-creating run locks for runs that haven't arrived yet and suspending batch jobs.
To predict future runs:
Go to the mission timeline viewer (glast-ground -> Mission Planning Web View -> Timeline), get the start time for the physics runs, then plug them into xTime. Make sure to uncheck "Apply Clock Offset Correction(s) for RXTE and Swift" at the bottom of the page. By default the timeline doesn't go very far into the past, you may need to change that by clicking on "selections" in the top right corner of the page.
Making run locks:
They have names like /nfs/farm/g/glast/u52/L1/r0263753970/r0263753970.lock
At the moment it doesn't matter what's in them ![]() , a half-sentence explaining why you made the lock is good. An empty file, or a rant about how much it sucks that you have to do this, works also. When you're ready to let the run go, just remove the file and the run should start up in 5-10 minutes.
, a half-sentence explaining why you made the lock is good. An empty file, or a rant about how much it sucks that you have to do this, works also. When you're ready to let the run go, just remove the file and the run should start up in 5-10 minutes.
![]() Actually the locks created by L1 do have meaningful content, and Bad Things will happen when it tries to remove them if it's not correct. But if you make one by hand L1 won't remove it, you have to, so it's OK to put whatever in there.
Actually the locks created by L1 do have meaningful content, and Bad Things will happen when it tries to remove them if it's not correct. But if you make one by hand L1 won't remove it, you have to, so it's OK to put whatever in there.
Suspending jobs
If the first part of a run is processing and you want to stop the second part from starting at a bad time, use the pipeline front end to get the LSF job ID of the findChunks process for the second part (which will be pending due to the run lock placed by the first part), log into a noric as glastraw and use bstop to suspend it. bresume it when you're ready to let it run.
If both parts of a run arrive while it's locked out, you can reduce the total amount of I/O that it does by letting the smaller part go first, since all of the data in the part that goes first has to be merged twice. Suspend findChunks for both parts, remove the run lock, then resume findChunks for the part with less data. "Less data" == "fewer chunks" unless it's highly fragmented, in that case du on the evt chunk directory (like /afs/slac.stanford.edu/g/glast/ground/PipelineStaging6/halfPipe/090512001/r0263753970) may give a better idea.
The Throttle
Yay!
There's now a throttle that limits the number of RDLs that can be in process (or in the hard part, at least) at once. It works by making files with names like /nfs/farm/g/glast/u52/L1/throttle/1.lock at the same time as it makes the run lock. Usually set at 2, 3 is probably safe but we're still not quite convinced. It's still under development and a bit fragile, so it's probably better not to mess with it for now.
AFS buffers & idle threads
When the AFS servers where we keep temporary files hiccup, it's usually because they ran low on idle threads. It is possible to monitor this value and intervene to stave off disaster. It can be viewed with Ganglia or Nagios. Nagios only works inside SLAC's firewall, but is somewhat more reliable. Ganglia works from anywhere, and shows higher time resolution, but sometimes it stops updating and just shows a flat line with some old value.
Ganglia
- Ganglia threads page shows idle threads for all servers.
- Warren's custom disk monitoring pages shows just the servers we're actually interested in, and shows the mapping between server and volume names.
Nagios
- Using ssh as a proxy: You can use ssh as a SOCKS proxy to relay requests through a SLAC computer.
- Pick a port. Should be a 4-digit number. Referred to as <port> below.
- ssh -D <port> noric.slac.stanford.edu
- Then configure your browser to use a SOCKS proxy at localhost:<port>
Now you should be able to access SLAC-only pages. There's 2 places to get the threads:
- new nagios (02) click "Hostgroup Overview" on the left side, then the host you want in the "AFS fileservers" table. This shows idle threads for that server on the "AFSfs" row.
- old nagios (01) then click "AFS FS Graphs" in the upper left. This shows most or all SLAC AFS servers. Not as reliable as nagios02, and it's going away eventually.
- Warren's "old" 1-hour page
There's 3 places to get the information...
What to do with the info
When the servers are idle, idle threads should be 122. The SLAC IT people consider it a warning if it goes below 110 and an error at 100. For us, it seems llike things usually work as long as it stays above 60 or so (although afs112 has been known to go as low as 40, since PipelineStanging6 is for the HalfPipe). This is likely to occur if there are more than ~300 chunk jobs running. Usually after recon finishes and the chunk-level jobs downstream of recon start up. I've written a script that will suspend jobs that are using a specified server, wait a bit, and then resume them with a little delay between. Suspending jobs will make the server recover sooner, but some of the jobs are likely to get timeout errors and fail due to the delay of being suspended, so it may be best to wait until idle threads hits 0 before suspending.
- From a noric, as glastraw:
- setenv L1ProcROOT /afs/slac.stanford.edu/g/glast/ground/PipelineConfig/Level1/1.70 (any L1 version >= 1.70 should work)
- $L1ProcROOT/tools/grepJobs.py PipelineStaging2 1200 60
- first arg is the volume to be suspended
- second arg is seconds to wait between stopping and resuming
- third arg is seconds to wait between resuming jobs
- If you want to do afs106, you have to say "PipelineStaging/"; if you say "PipelineStaging" it will suspend everything.
The association between disk and server can be found in several ways. Here's one:
- $ fs whereis PipelineStaging*
- File PipelineStaging is on host afs106.slac.stanford.edu
- File PipelineStaging1 is on host afs106.slac.stanford.edu
- File PipelineStaging2 is on host afs104.slac.stanford.edu
- File PipelineStaging3 is on host afs107.slac.stanford.edu
- File PipelineStaging4 is on host afs108.slac.stanford.edu
- File PipelineStaging5 is on host afs109.slac.stanford.edu
- File PipelineStaging6 is on host afs112.slac.stanford.edu
- File PipelineStaging7 is on host afs113.slac.stanford.edu
You can also find the amount of disk usage with the following command:
- $ fs lq PipelineStaging*
Volume Name Quota Used %Used Partition
G.glast.ground.PipStg 350000000 128422194 37% 26%
G.glast.ground.PipStg 350000000 128422194 37% 26%
G.glast.ground.PipStg2 350000000 118129732 34% 24%
G.glast.ground.PipStg3 350000000 124826187 36% 26%
G.glast.ground.PipStg4 350000000 124744630 36% 26%
G.glast.ground.PipStg5 350000000 132978520 38% 27%
G.glast.ground.PipStg6 350000000 59700367 17% 12%
G.glast.ground.PipStg7 350000000 107201000 31% 22%
Useful resources
- List of failed runs. Report here failed runs and their status. When a run is fixed (meaning: no red cross appears anywhere anymore), you can delete it from the list (the runs listed as 'ignore error (it is fixed)' are the ones that were fixed with a fake delivery, so they still appear as failed in the Data Processing page.
- AFS hiccups. We keep track here of the AFS hiccups (or at least we try to). You can add date/time, LFS job ID and the 'missing' file.
- LSF hiccups. We keep track here of the LSF hiccups (or at least we try to). You can add date/time, LSF batch host(s) and the reason, if known.
- List of runs incorrectly marked as InProgress. These are runs where acq status is Complete, but L1 status is InProgress.
You should definitely join the following mailing lists:
- Data Handling (datalist)
- Level 1 processing (l1proclist)
- Data processing pipeline (pipelinelist)
And probably these:
- LAT Instrument Data Monitoring (datamonlist)
- Questions and problems concerning GLAST software (helpsoftlist)
- LAT operations team (latopslist)
- Nagios alert messages (nagios)
- People who will work ISOC shifts (shiftslist)
- ISOC Science Operations (solist)
Other things you may want to know
setL1Status task
Tired of being paged because L1Proc status still says Failed after a rollback?
/afs/slac/g/glast/ground/bin/pipeline --mode PROD createStream --define "runNumber=240831665,l1RunStatus=Running" setL1Status
OR:
/afs/slac/g/glast/ground/bin/pipeline --mode PROD createStream --define "runNumber=240837713" setL1Status
l1RunStatus defaults to Running, but you can set it to any of the allowed values (Complete, InProgress, Incomplete, Running, Failed).
How to contact SCCS
- Send an email to unix-admin (this usually works, even in the night and in the weekend).
- If you don't get an answer and the issue is urgent, call xHELP (650-926-4357). Choose 4 to page the on-call person.
- If your call/email isn't answered and the issue is REALLY urgent, page again the on-call person at 650-846-0178.
Log Watcher Messages
* The monitoring shifter doesn't need to do anything about it. The L1 shifter should figure out why it happened. In this case, it was because I rolled back a merge job in a run that was already done. (Warren)Message text: Can't open lockfile /nfs/farm/g/glast/u52/L1/r0248039911/r0248039911.lock.
cancelProcessInstance
Here's the syntax to cancel a process that is not in final state, and all its dependencies:
/afs/slac.stanford.edu/u/gl/glast/pipeline-II/dev/pipeline --mode PROD cancelProcessInstance 8073657
The Process Instance Primary Key (ie - 8073657 in the example) can be determined in the the URL for the process instance page (eg: the PIPK for http://glast-ground.slac.stanford.edu/Pipeline-II/pi.jsp?pi=20253756 is 20253756).
NOTE: Please don't use this unless you really (REALLY!!!) know what you are doing.
Host or host group is not used by the queue.
If you see jobs being terminated with exceptions in the message viewer saying things like "yili0148+5: Host or host group is not used by the queue. Job not submitted.", it means the hosts available to glastdataq have changed. The solution is to roll back the affected chunks (the doChunk streams) with a new value for HOSTLIST. When you roll back the streams from the frontend, on the confirmation page you are presented an opportunity to set or redefine variables. To figure out what the new value needs to be, do a "bqueues -l glastdataq". The output will include a line like "HOSTS: bbfarm/". In this case you'd enter HOSTLIST=bbfarm in the box on the confirmation page. bbfarm is actually a temporary thing for the cooling outage, when things get switched back to normal, the relevant line from bqueues will probably look more like "HOSTS: glastyilis+3 glastcobs+2 preemptfarm+1". Then the thing to enter in the box would be HOSTLIST="glastyilis glastcobs genfarm".
setCrashed skipped for successful stream
If everything goes well, then the setCrashed substream will be skipped. Makes sense to think about it, but could be confusing at first glance.
Red question marks in display
Red question marks show up in the display for HalfPipe. Click on the FASTCopy "Logs" number. First check to see if the "ProcessSCI.end" event has occurred. If not, then wait until it occurs and see if the red question mark persists. If it persists and the log shows messages saying "pipeline nonEventReporting submission succeeded" or "no reassembled datagrams found", it just means that it contained data that had already been received. Meaningful deliveries will say "found XXX LSEP datagrams in ....". If it is a meaningful delivery, then further intervention is required.
Stuck processes
If you suspect a process is stuck, visit the process page from the run page (ie - click on the green task bar in the Data Processing Page, then click on the particular job that is running in the list at the bottom of the page). Each entry in the table on the page will contain a link to "Messages", "Log", and "Files". If you click on "Log", it should show you the log, but more importantly, it'll show the location of the log file right above the box containing the log information (note: if the file is too big, it will not open, but the link to "Files" will show where the log is located, so you can get the information that way as well). If you visit the location of the file on the noric machines, you can determine when the last time the file was updated (ls -l, or tail -f to see if it's still streaming). If it is not updating, find out the batch job number (JobId from the stream table), log into noric as glastraw, and issue a bkill <JobId>. The process should automatically be restarted after this command is issued.
Repiping
When weird things are happening with the delivery that you can't figure out, it may be necessary to repipe the stream (probably a good idea to check with someone first). Log in as glastraw and issue the following command:
/afs/slac.stanford.edu/u/gl/glast/pipeline-II/prod/pipeline -m PROD createStream --stream ${ID} --define downlinkID=${ID},runID=${ID} RePipe
where ${ID} is the Run ID. This will create a directory in /nfs/farm/g/glast/u28/RePipe ... you will need to then manually re-enter the run into L1Proc. To do this, bkill any findChunk processes that are associated with the RunID, remove the run lock from /nfs/farm/g/glast/u52/rXXX (where XXX is the run number), also move all chunkList files to something else (just suffixing them with ".ignore" should work) and issue the following command:
/afs/slac.stanford.edu/u/gl/glast/pipeline-II/prod/pipeline -m PROD createStream --stream ${ID} --define DOWNLINK_ID=${ID},DOWNLINK_RAWDIR=/nfs/farm/g/glast/u28/RePipe/${ID} L1Proc
You should be able to see if the process restarted correctly by visiting here, which will tell all the streams that have not resulted in "Success".
Batch commands
bjobs -wu glastraw - running this from noric will list all the jobs in the LSF batch queue owned by glastraw (which is the user submitting pipeline streams).
Shift sign up
Sign up for shifts here. View shift calendar here
Useful L1Proc links (these are designed to keep you from waiting for the entire L1Proc history to be retrieved ... which could be 10 min and up).
- All L1Proc Deliveries that have not completed
- All L1Proc Runs that have not completed
- All L1Proc Runs that have failed with a timestamp (it is a good idea to update your timestamp to shorten the search).