The page will be used to track issues arising during Infrastructure Shifts.
Please check the list of known problems
December 16
u19 disk was almost full. Turned out confluence had gone crazy and was creating huge indexes in
/nfs/farm/g/glast/u19/tomcat/data/confluence/index/plugin/usage
I simply deleted everything in that directory, and restarted tomcat04. I am not sure if this will happen again. Incidentally the following plot is useful for tracking the disk usage of u19:
Sept 3
(RD) 12:15 Turkey - Restarted tomcat07 after complaints about slow performance, and missing DQM histograms.
Aug 30
(CH) 10:34 glastlnx21 back to normal.
(CH) 10:27 Nagios showing glastlnx21, Xroot file scanner hung. Tried to stop then restart glastlnx21 (from How-To-Fix instructions) but it had no affect. Sent email to Tony and Wilko for further advice.
Aug 27
(CH) 13:30 nagios shows that glastlnx07 was failing to connect or perform i/o. glastlnx07 restarted by Dan.
(CH) 10:00 Work on 2nd floor of the computer building inadvertently brought down afs107-109. SCCS notified and the disks came back up around 10:40.
Aug 21
(TG) 15:00 tomcat09 on glastlnx16 appears to have run out of file descriptors / handles causing error messages and/or crash within the pipeline front end and in run quality page. Tomcat09 restarted.
(TG) 17:15 Usage plots on Pipeline web page fail to come up. The mechanism (aida plotter?) and how to restart it does not seem to be documented; email to Max/Tony to help fix and document. [Added later: The fix turned out to be restarting tomcat09 on glastlnx16 a second time. Apparently, for some reason, the plotting app did not come up properly the first time and needed a rebounce.]
Aug 20
(RD) 21:00 The creaky web007 server did not reboot properly after the monthly windows patching. Rodney had to restart it, but then confluence and jira did not come up properly. I flailed around a bit, with the lack of how-to-fix - restarting tomcat04 and getting glastlnx08 rebooted. But to no avail. Tony came to the rescue overnight from London, restarting the web007 web server. We need to update the confluence how-to-fix to cover this, and also to get a copy outside confluence! Tony has it in his queue to complete the replacement of web007 with a new machine.
Aug 19
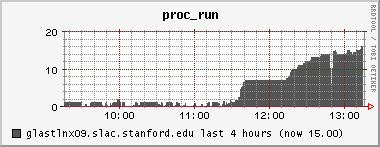
(TG) Complaint about slow DQM pages - but the tail of the DataQualityMonitoring.2008-08-19.log file shows no evidence of Known Problem #1, namely no indication of a failed xroot connection. Ganglia indicated a very heavy CPU load which "top" and "ps" indicated was the result of java and the tomcat server. There were literally many dozens of java threads, all vying for CPU. Some illustrative plots attached.
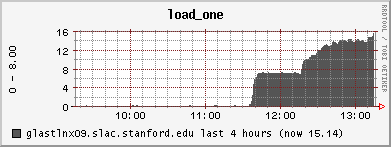

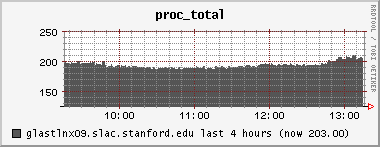
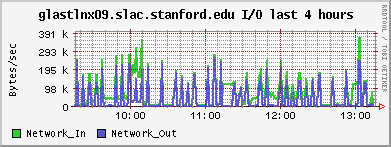
13:20PDT tomcat07 was restarted. Load is now normal.
Aug 16
(WBF) Restarted tomcat10 because the log watcher was acting up. It didn't help.
(RD) 08:50 Jim noted that the ASP light curve plots had vanished. He looked in dbvis and thought the tables had disappeared. But a reconnect to dbvis got them back. I restarted tomcat02 and then the 2 ASP DataViewers I saw in the Applications list in Server Monitoring. The plots are back. Why are there 2 and why is the one on tomcat02 listed as unregistered?
Aug 15
(RD) 21:30 Error - Oracle could not extend glasttrend table space. Ian fixed it, but is wondering why the oracle alarm system did not catch this before it ran out.
Aug 13
(WBF) Restarted tomcat09. I think memory was ~70%. Pipeline frontend, shift schedule, and run quality were all giving java stack traces.
Aug 12
(RD) Two sets of problems. The 2 Black Boxes were serviced to replace faulty sensors. Sadly, a group of cores in them was not turned off in LSF before turning them off, so a mess was made in L1. Then it seems a different set of cores developed AFS access problems. They were shut down to LSF. John Bartelt will look into how the group of bali's escape glastdataq shutdown.
Aug 8
(MT) 06:30 [Restarted] Prod Crawler. It was stuck with the usual xrootd waiting messages.
(TJ) I think the problem may have been caused by running out of memory due to large skimmed FITS files I registered in the datacat last night. I have a more efficient way of reading FITS file from xrootd which I should install into the crawler.
Aug 2
(RD) 07:15 Michael reported overnight that some mount points under $GLAST_EXT in afs seem offline. I've sent mail to unix-admin about it, and detailed a bit in opsproblist. If they don't get to it this morning, they should be paged. Renata rebooted the server around 08:45.
July 29
(MT) 12:15 Restarted tomcat12. It ran out of memory.
July 26
(TJ) /scratch on glastlnx16 had filled up. Nagios was complaining about glast-tomcat09 although it was mostly still functional. The cause was a test version of confluence which had filled the scratch disk with backup files. The files have been deleted and backup has been disabled on this instance of confluence.
July 22
(RD) 00:23 Got phone call from Elliott that DQM was unresponsive. Confirmed and restarted tomcat07. Seems ok now.
July 20
(TJ) A new application has been installed on glast-tomcat09 to make the CountdownClock available at: http://glast-ground.slac.stanford.edu/CountdownClock/![]()
(RD) Problems with LSF around 5am or so. One machine (fell0147) ran out of memory and became a black hole for jobs, killing them instantly. SCCS was paged and the problem resolved by around 09:30.
July 19
(CH) glastlnx04 seemed to show up on the nagios critical list and remained in the red more frequently than normal. Reported this to Tony and unix-admin.
(TJ) This appears to be a problem with the nagios monitoring timing out, rather than a real problem with glastlnx04 or with the pipeline job control.
July 18
(TJ) The DataCatalog has been moved from tomcat09 to tomcat08, to isolate it from the other critical application on tomcat09 and to see if it is responsible for using up jdbc connections. A copy has been left running on tomcat09 to keep nagios happy until Emmanuel can update the nagios configuration.
July 17
21:30 (CH) No major problems to report.
July 16
3:30 - 6:30 am Slow/Unresponsive applications from tomcat09. JDBC connection pool was 100% busy. Increased maxActive to 20 (it was 8). The server was restarted.
July 15
20:45 (CH) There was a scheduled outage of the LSF master server causing some runs to fail.
After the server came back up some jobs were tagged as suspended (SSUSP) and it wasn't clear whether to wait or kill them and resubmit. The boer* batch machines did not respond when ping'd. This was reported to unix-admin.
July 14
09:00 (KH) Same problem as at 00:30. Tomcat09 restarted.
00:30 (TJ) I restart tomcat09 since all of the pipeline-II JDBC connections were in use. The problem persisted after the restart, although the applications were still responding, then after about 15 minutes the problem seemed to go away by itself.
July 13
01:00 am Restarted tomcat07 due to Data Quality Monitoring Unresponsive.
19:30 (TG) Another instance of DQM web page failing to come up on DS terminal. Problem resolved after two restarts of Firefox. GDM-122@jira.
July 12
glastlnx12 (OpsLog and Pipeline-II PROD) crashed for unknown reasons, and was restarted by Chuck Boehiem.
DQM trending app was failing for Anders with GDM-122@jira.
Clearing the session (by restarting the browser, or in Ander's case clearing the glast-ground cookies) fixed the problem
July 11
With reference to the TelemetryTrending problem, nagios had been complaining about tomcat12 for sometime. It monitors the tomcat servers using probe's "quickcheck" feature. This was showing that all of the JDBC connections were used up. This could just be a side effect, since if the application hangs while it has a DB connection open that will soon use up all of the connections.
8:45 am I restarted the dev datacat crawler (using the button on the datacat web admin page)
8:20 am same as below. TelemetryTrending application unresponsive.
5:30 am TelemetryTrending application unresponsive. Restarting the server fixed the problem. No evidence was found in the log files.
July 10
5:30 am TelemetryTrending problem fetching data from XML-RPC
http://glastlnx24:5441: org.apache.xmlrpc.XmlRpcException: Failed to create input stream:
  Connection reset
or
  Connection refused
This is a problem with the XML-RPC python server. This problem should be brought to the attention of the FO shifter.
19:20 (Richard, for Tony)
Batch jobs were taking a long time, apparently being slow, but were in fact failed with no log files produced. Was tracked down to DNS failures on the balis. It has been reset (reported by Neal Adama at 18:15). Unix-admin ticket [SLAC #120230].
July 5
7:10 pm I restarted tomcat12 since the monitoring programs were complaining and ServerMonitoring showed it missing - Tony
July4">July 4
6:00 pm Old DQM ingestion script put back into production. The new script worked fine for some 24 hours and then we started having "idle" sessions locking out all the following ones. There were some 60 of them waiting. Killing the first one did not solve the problem as the next one went in "idle" state. We decided to kill all the waiting sessions and put the old script back in production. The failed ingest scripts are being rolled back.
{panel:title= All the sessions have been killed off. Is it the same script that ran successfully yesterday. The database was waiting on sql*net message from client which usually means a process has gone idle. The two processes both went idle after issue insert into DQMTRENDDATAID (dataid, loweredge, upperedge, runversionid) values(:1,:2,:3,:4) There was no further action being taken by either session such as reads, execute counts, etc. So either the process was idle or it didn't have enough resource to even attempt what was to be executed next. I think for now the old script is probably best to run. It would be nice is serialization wasn't done via locking. It would also be good if I could adjust a couple of database parameters which requires a shot shutdown.
July3">July 3
01:00 Restarted tomcat07 due to Data Quality Monitoring Unresponsive.
01:00 PM New DQM ingestion script put into production to avoid ORACLE slowdowns. If any problems, please contact Max.
July2">July 2
02:55 Restarted tomcat07 due to Data Quality Monitoring Unresponsive.
July1(CanadaDay)">July 1 (Canada Day)
19:50 - Data Processing page went unresponsive for 2.5 hours. See GDP-26@JIRA and SSC-84@JIRA
June29">June 29
3:38 pm Restarted glast-tomcat07. Data Quality Monitoring Unresponsive
RunQuality Exception
Cannot set the run quality flag due to GRQ-4@JIRA
June27">June 27
11:55am Restarted glast-tomcat07. Data Quality Monitoring Unresponsive
12:25am: OpsLog and Monitoring/Trending web-apps interfering with each other
June26">June 26
Outstanding Issues:
David Decotigny requests we get calibration trending working again.
10:18pm Web severs are working again:
The root problem was a software crash on rtr-slb1.
I just came in after Mike called me on the phone and power cycled the machine. It has come up fine and all services should now be restored.
Update on this...
As Sean says, the servers are up. swh-servcore1 shows both ports connected vlan 1854, full 1000. They are on 7/5 and 7/6.
I called Antonio and he saw that a small router had a hiccup/crashed??
He is going to SLAC now to reboot the router.
10:06pm The problem is believed to be a "small network switch between our servers and the main switch". They are going to try power cycling it.
glast-win01 and glast-win02 became unreachable at 9:20pm. The SCCS on call technical contact has been paged (926 HELP). We just received the following e-mail:
I just spoke with Mike, the servers are physically up but there seems to be a network problem. Mike is working on contacting the networking team to investigate on their end.
- Had to [restart PROD data crawler] one time (because Nagios and http://glastlnx20.slac.stanford.edu:5080
 were complaining). Looks like problem was caused by MC writing to DEV version of xrootd on glastlnx22.
 - Problems with Run Quality monitoring reported yesterday now fixed.
June 25
From OpsLog
Watching plots on the web is right now very slow...
**Comment by David Paneque on Thursday, June 26, 2008 5:20:39 AM UTC
It is so from both, the shifter computers and our laptops.
**Comment by David Paneque on Thursday, June 26, 2008 5:21:33 AM UTC
now it is fast again...
**Comment by Tony Johnson on Thursday, June 26, 2008 5:55:18 AM UTC
Trending plots, data quality plot, all plots? One possibility is that xrootd load slows down plotting (some plots are read using xrootd). I noticed there were some ASP and MC jobs running in the pipeline around this time which may have been slowing things down.
**Comment by Tony Johnson on Thursday, June 26, 2008 6:07:59 AM UTC
Indeed in the DataQualityMonitoring log file around this time I see lots of messages about waiting for response from xrootd.
Outstanding Issues:
ELG-18@jira OpsLog session times out immediately after login.
[] Some plots in data monitoring are inaccessible (message says plot not available), even while the same plots are accessible from another browser at the same time. Maybe this is also related to the workstations in the control room running firefox 1.5 (seems unlikely)? See discussion in OpsProbList.
[] Jim reported that several of his scripts were running and were killed when the pipeline server was restarted. We need to understand why his data catalog queries are still taking so long >10 minutes to run.
[GRQ-1] Run quality status is not being updated even though change entries are made in the history table. I looked at the code but could not see anything obvious wrong, maybe I am too sleepy.
[LONE-72] Attach intent as meta-data to files
[LONE-71] Digi merging loses IObfStatus - results in Digi files being marked as ContentError in Data Catalog
18:24 PDT A new version (1.2.4) of the pipeline has been installed. See https://jira.slac.stanford.edu/browse/SSC-74![]()
TelemetryTrending application crashes
The telemetry trending application had to be restarted a couple of times in the last 24 hours. This has been caused by large memory usage when tabulating the data IOT-87@jira.
I am working on a fix.
In the meantime monitor the memory usage of tomcat12 from the Server Monitoring![]() application.
application.
When memory gets close to 90% try clicking on "Force GC" (If you don't see this link you need to be added to the ServerMonitoringAdmin group). If garbage collection does not reduce the memory usage a crash might be imminent.
Max
4am UTC
Tony: Waiting for data.... Registered my pager - sending to number@amsmsg.net seems to work (alias@MyAirMail.com does not)
Two outstanding (new) issues: PFE-172@jira IFO-24@jira!glastlnx09-2.gif! 