This is to keep archive of some checks of the distributions of some low- and high-level variables in bkg sets with overlays.
For the first comparisons I selected 2 bkg datasets, one without overlays (bkg-v15r39) and one with (v17r16). I selected some runs, to have little more that 200k events after the skim. The skim cut is simple, i.e.
ObfGamStatus>0 && TkrNumTracks>0 && CalEnergyRaw>5 && CalCsIRLn>4
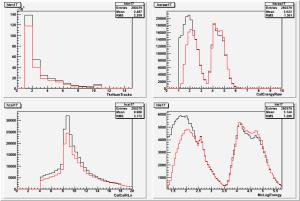
First, let's plot some key variables after this first skim. From here on red means no overlays, black means overlays.
Take care, there's no selection here on CTBBestEnergyProb yet! We'll see later that this is not an issue.
In general in the overlayed set I find that more events with low energy pass the trigger and the filter. Low energy, low CalEnergyRaw and few tracks.
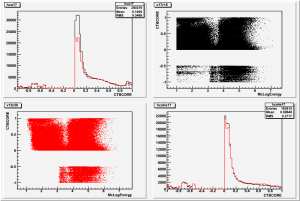
What happens to CTB vars due to these overlayed events? Ex: CTBCORE:

- Top left: CTBCORE. Overlayed events have lots of events at low CTBCORE. This should be due to the events with low energy
- Top right: McEnergy vs CTBCORE for overlays: note e.g. the corner at CTBCORE=0 and McLogEnergy=1
- Bottom left: same for no-overlays: the events in the corner are missing, these are the events that show up in the CTBCORE distributions
- Bottom right: CTBCORE distrib. for events with McLogEnergy>2.3 to cut low energy events
A more direct check: what is the difference for v17r16 events when overlays do not hit either cal or tkr? Compare newx plot on the right with bottom left in plot above.
Just to be sure: same plots with "CTBBestEnergyProb>0": no big change here.
Next, a look at the Psf CTB analysis to see what happens in detail to these events