You are viewing an old version of this page. View the current version.
Compare with Current
View Page History
« Previous
Version 4
Next »
PingER
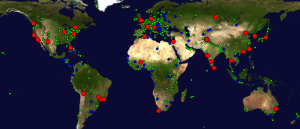
Worldwide coverage
(map)
|
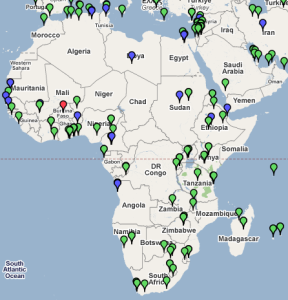
Coverage in Africa
(map)
|
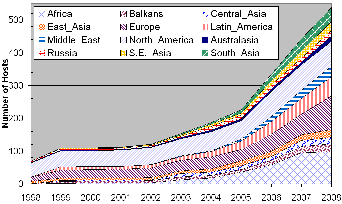
Increase in coverage
since 1998
|
|
 |
|
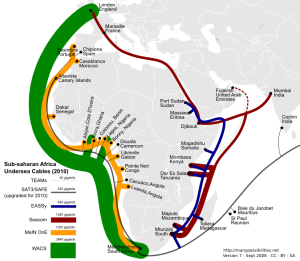
Submarine Fibre Links Connecting Africa
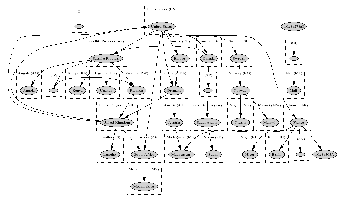
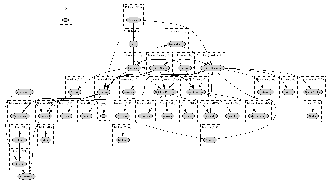
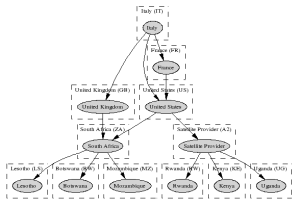
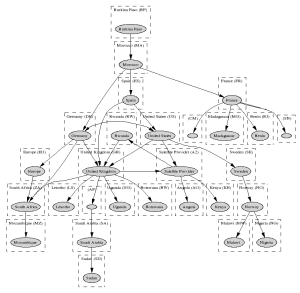
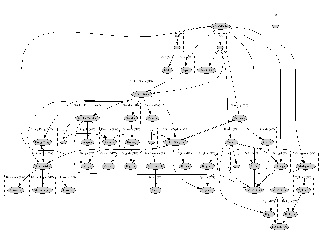
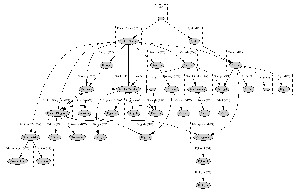
Routing to and within Sub-Saharan Africa
Generated by: PingER Route Visualizer
As seen from SLAC,
USA
|
As seen from SEECS/NUST
Pakistan, South Asia
|
As seen from ICTP
Italy, Europe |
 |
 |
 |
As seen from TENET,
South Africa
|
As seen from OUAGA,
Burkina Faso
|
 |
 |
As seen from UNSW,
Australia
|
As seen from KHU
South Korea
|
As seen from ACMESECURITY
Brazil |
 |
 |
 |
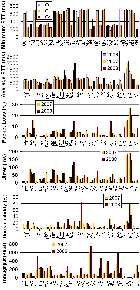
MinRTT, AvgRTT, Packet Loss,
Jitter and Ping Unreachability
2007 and 2008
(raw data)
|
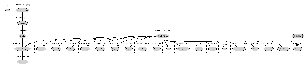
Derived Throughput (Kbps)
to the world as seen from
SLAC since 1998
(graphs)
|
 |
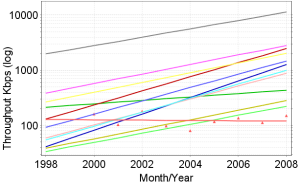
<ac:structured-macro ac:name="unmigrated-wiki-markup" ac:schema-version="1" ac:macro-id="550459b9-579e-4db8-80e5-9435a9237e54"><ac:plain-text-body><![CDATA[ [Red: Africa, Light-blue: Balkans, Light-green: Central Asia,
]]></ac:plain-text-body></ac:structured-macro>
Yellow: East Asia, Pink: Europe, Light-blue: Latin America,
Orange: Middle East, Grey: North America, Maroon: Oceania,
Royal-blue: Russia, Dark-green: S.E. Asia, Mustard: S. Asia,
Red-triangles: Africa - measurement points]
|
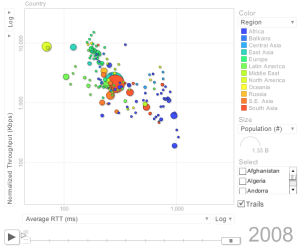
Selected PingER Visualizations
Motion Chart
Throughput VS Avg. RTT
|
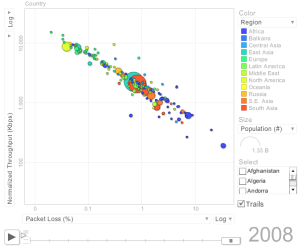
Motion Chart
Throughput VS Packet Loss
|
 |
 |