The goal is to use the located in the EPP lab so generate a signal integrity report, using the 48 DP cables provided. Each cable has to be tested 10 times, channels 1/2 for transmission outputs CMD/DATA0-3.
Initial setup via Vivado Lab
Please refer to Andrew Young (ayoung@slac.standford.edu) for more details
- Connect KCU105 board to PC via JTAG (make sure the cable supports sending data)
- Launch Vivado Lab
- Green Banner: Open New Target → Set JTAG Clock Frequency 30,000,000 (why?)
- Green Banner: Program device → Select 1p5625_example_ibert_ultrascale_gth_0.bit
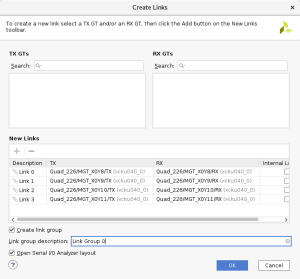
- Green Banner: Create Links → Add all 4 links using the "+" sign
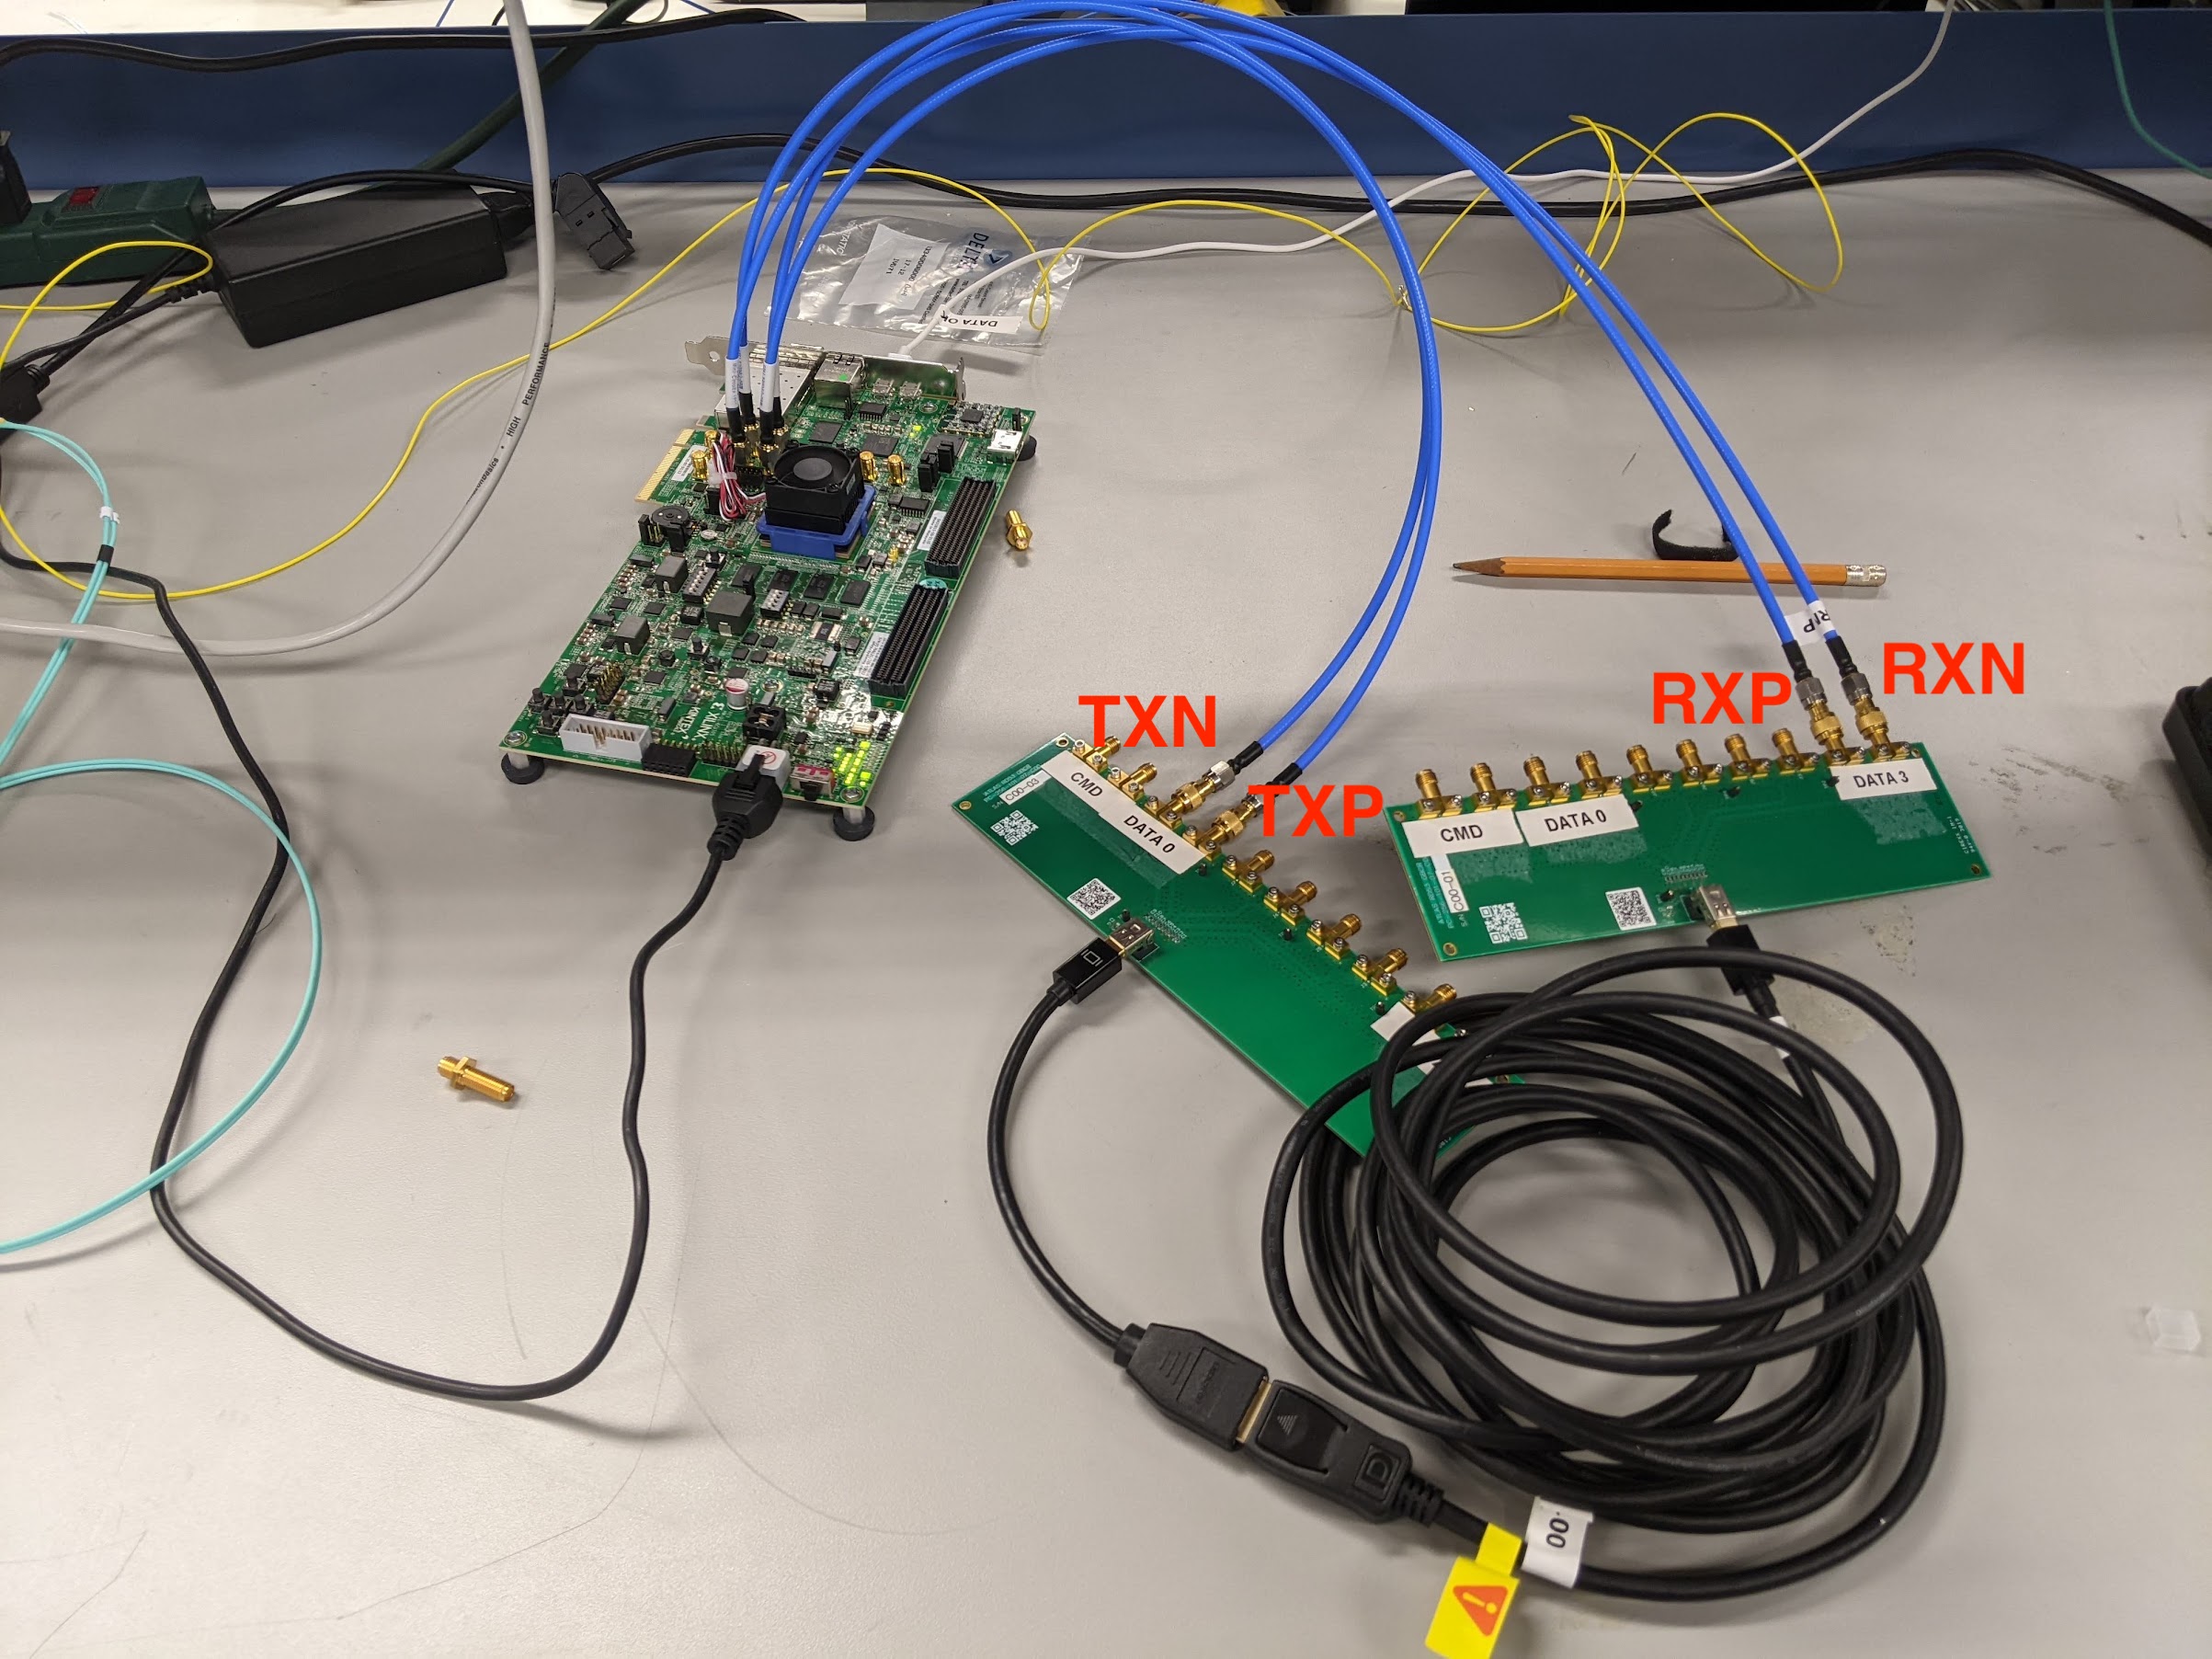
- Connect cables. There are 2 for transmission positive / negative (TXP/TXN) and 2 for receiving positive / negative (RXP/RXN) which are labeled on the KCU board. Since a single DP reverses the data lane connections, the connections on the two SMA to mDP adapter board should be matched as CMD → CMD, data0 → data3, data1 → data2, etc.
- To validate the setup we will do a simple eye scan with the KCU board. This requires us to also have the the P/N cables connected in the right order (remember to account for the flip in the data lanes). See below picture for the correct setup for data lanes. If you are only using the board to drive a signal to the oscilloscope the P/N polarity doesn't matter
- If everything is connected properly one of the links should be up which shows that the KCU board can receive the signal it is sending
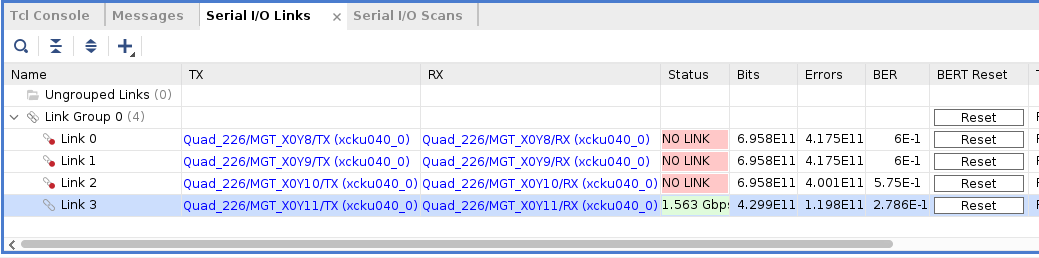
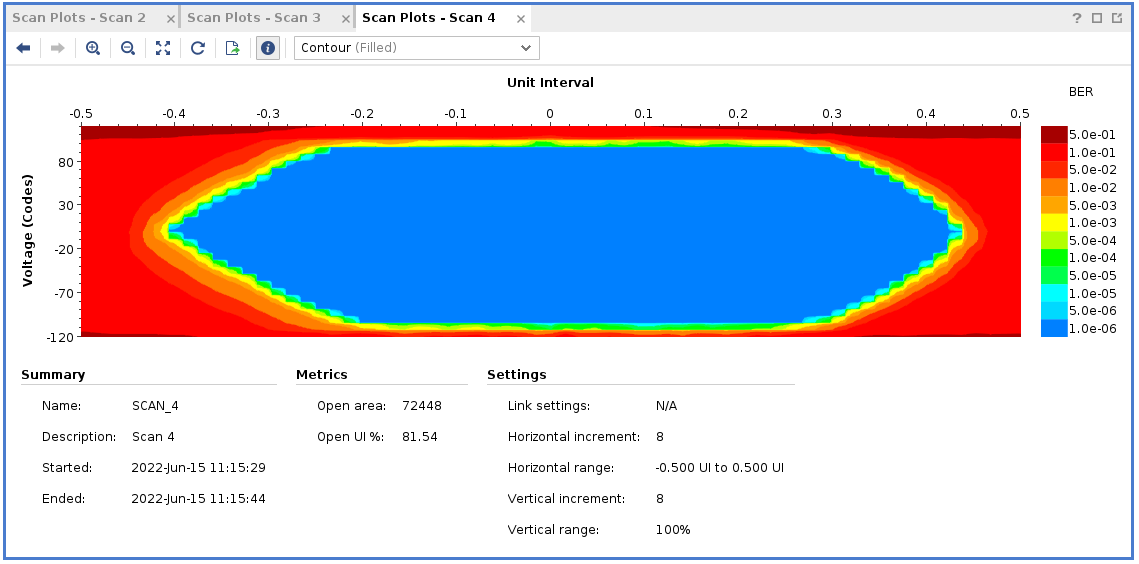
- Select the link which is up (Link 3 here) → Create Scan. Here you can specify the BER as well as the horizontal/vertical increments
- If you see an eye then the setup works. Unfortunately the setup does not give the amplitude of the RX signal (requires recompiling the firmware?) so we will do all quantitative measurements with the oscilloscope. Connect the RX side to the oscilloscope now and follow the further instructions below.
QC Tests
Once the setup is complete, follow these instructions to test and generate/save the needed report. Make sure to have a sufficiently large USB flash drive connected to any of the USB input ports on the left hand side of the machine, towards the rear.
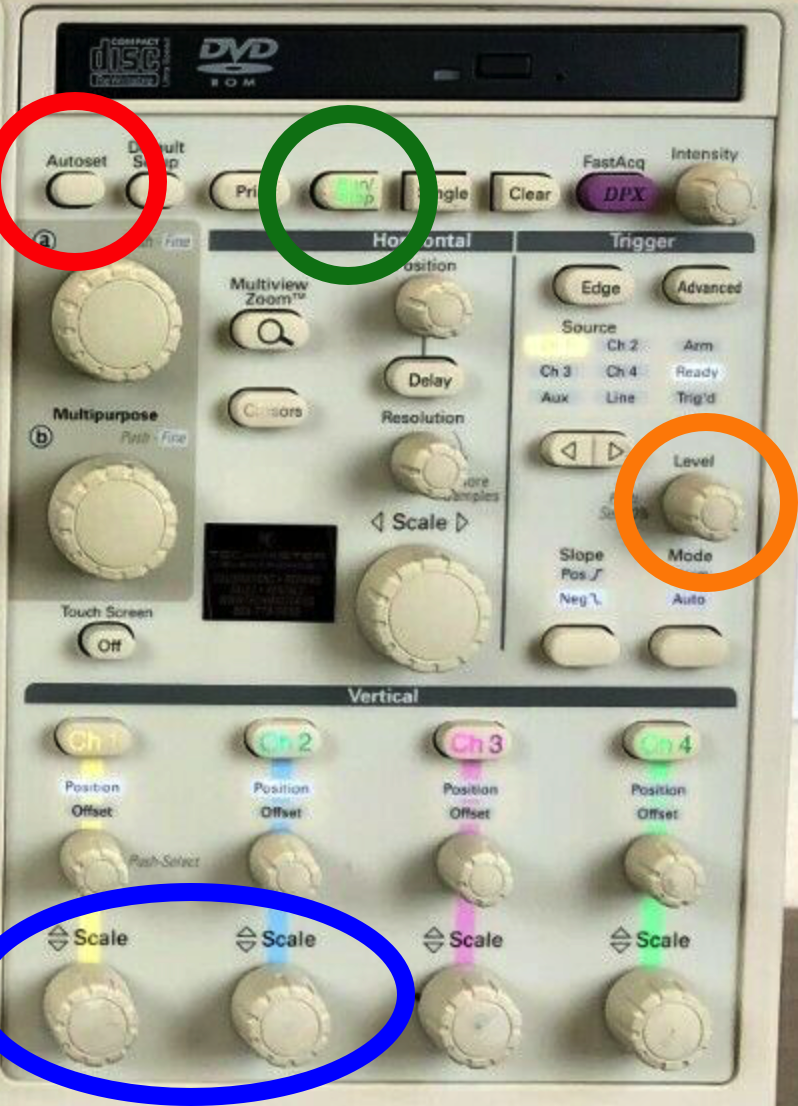
- Use the Autoset button to initially set parameters of interest.
- You should now see 2 signals, one in yellow and one in blue, for each of the signals
- Adjust the Scale knobs until the scale reads 300mV in the bottom left corner of the screen
- Now use the Level adjustment to set the trigger. You do this by watching the yellow arrow located on the right side of the display (next to the channel 1 yellow signal). You want the arrow to be on the positive side of the signal (imagine sin(π/4) or so), if you are in the correct place the "trig" light directly above the know should illuminate.
- Now you can run the first test, go to Analyze on the top toolbar, then **Something Jitter** (about 5 or 6 down from the top), then One Touch.
- This will take a moment, but it should display 4 plots, with the eye diagram in the bottom right corner. Channel 1 is the default, so it will automatically start with Channel 1.
- Go to Reports in the bottom left corner of the screen
- Select "Save As" on the right side of this panel. From here you can select your USB drive if you wish.
The naming convention should go as follows: SN${SerialNumber}_Chn${Channel}_${DataPort}. For example, if you were testing cable DP001, on the data1 output and channel 2 it would read: SNDP001_Chn2_Data1
- Now you can move on to test Channel 2.
- After the report is saved and the browser window is closed, close the "plots" window to make the 4 plots that you saw go away. You should now see the signal again.
- Press the Run/Stop button to get the signal going again.
- Change the source to channel 2 by using the < | > arrow button located just to the left and above the level knob.
- Now you will be using the level knob to set the trigger level for the blue signal, or channel 2. Again just shoot for the positive side of the signal and verify the "trig" light is on
- Once this is done, go down to the window that you selected Reports on and press the Results option. ????Choose the config panel and hit the channel 2 button to add it to the list underneath, then choose "Apply All".
- Press the "ReCalc" button on the right of this window.
- This should start the entire process over again, once it's finished and now plots pop up, you can go back to the Reports window, and save the report modifying the save name accordingly.
- Now just remove the quick connect cables from the cmd data ports and move to data0, you can just go back to step 7, hit "ReCalc" and it will scan again, save the report and change back to channel 1.
- You only need to start all the way over when you change USB cables, after cmd, data0, data1, data2 and data3 is scanned and the reports are saved. You should also not have to turn off anything until the very end, you can unplug and plug in the new cables on the fly.
Update:
Better to do all measurements on Math1 = Ch1 - Ch2 to half the number of tests required. Press Clear → ReCalc for every new channel. Record the signal amplitude, eye height, and eye width @ 10e-12 BER as a comparison.
Results for the first batch of 44 DP cables can be found here.