FOT Plots
(Joe Eggen) The following plots were provided by the Flight Operations Team. Re-posting them here for convenience.
FSSC Plots
(JE) The following plots were made using GBM temperature data provided by the FOT and FT2 files created by the FSSC during mission planning.
Note: as-flown FT2 files contain data gaps coinciding with SAA passages. Since the differences between the predicted vs. as-flown FT2 files are normally very small, I just used the predicted files here.
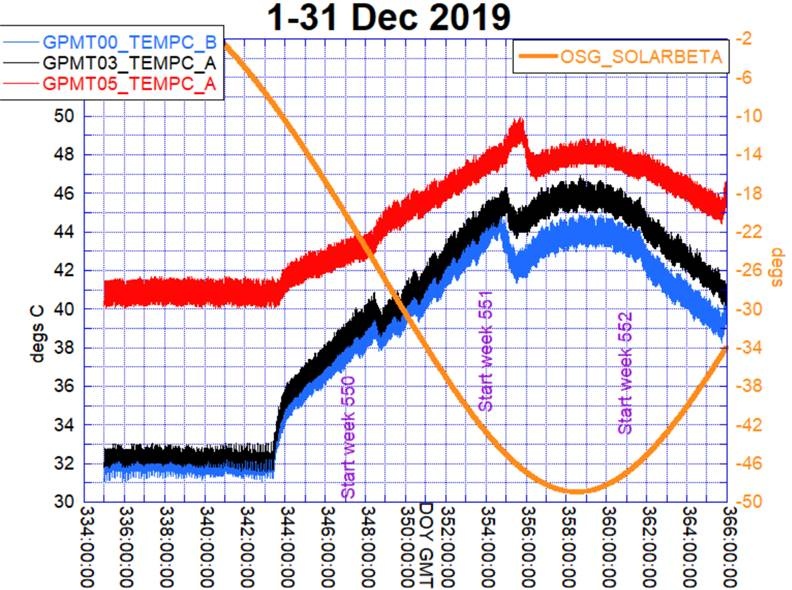
December 2018
Peak beta of -49.0° occurred on Dec. 24 (DOY 358) at 15:00 UT. (More details forthcoming, following sleep...)
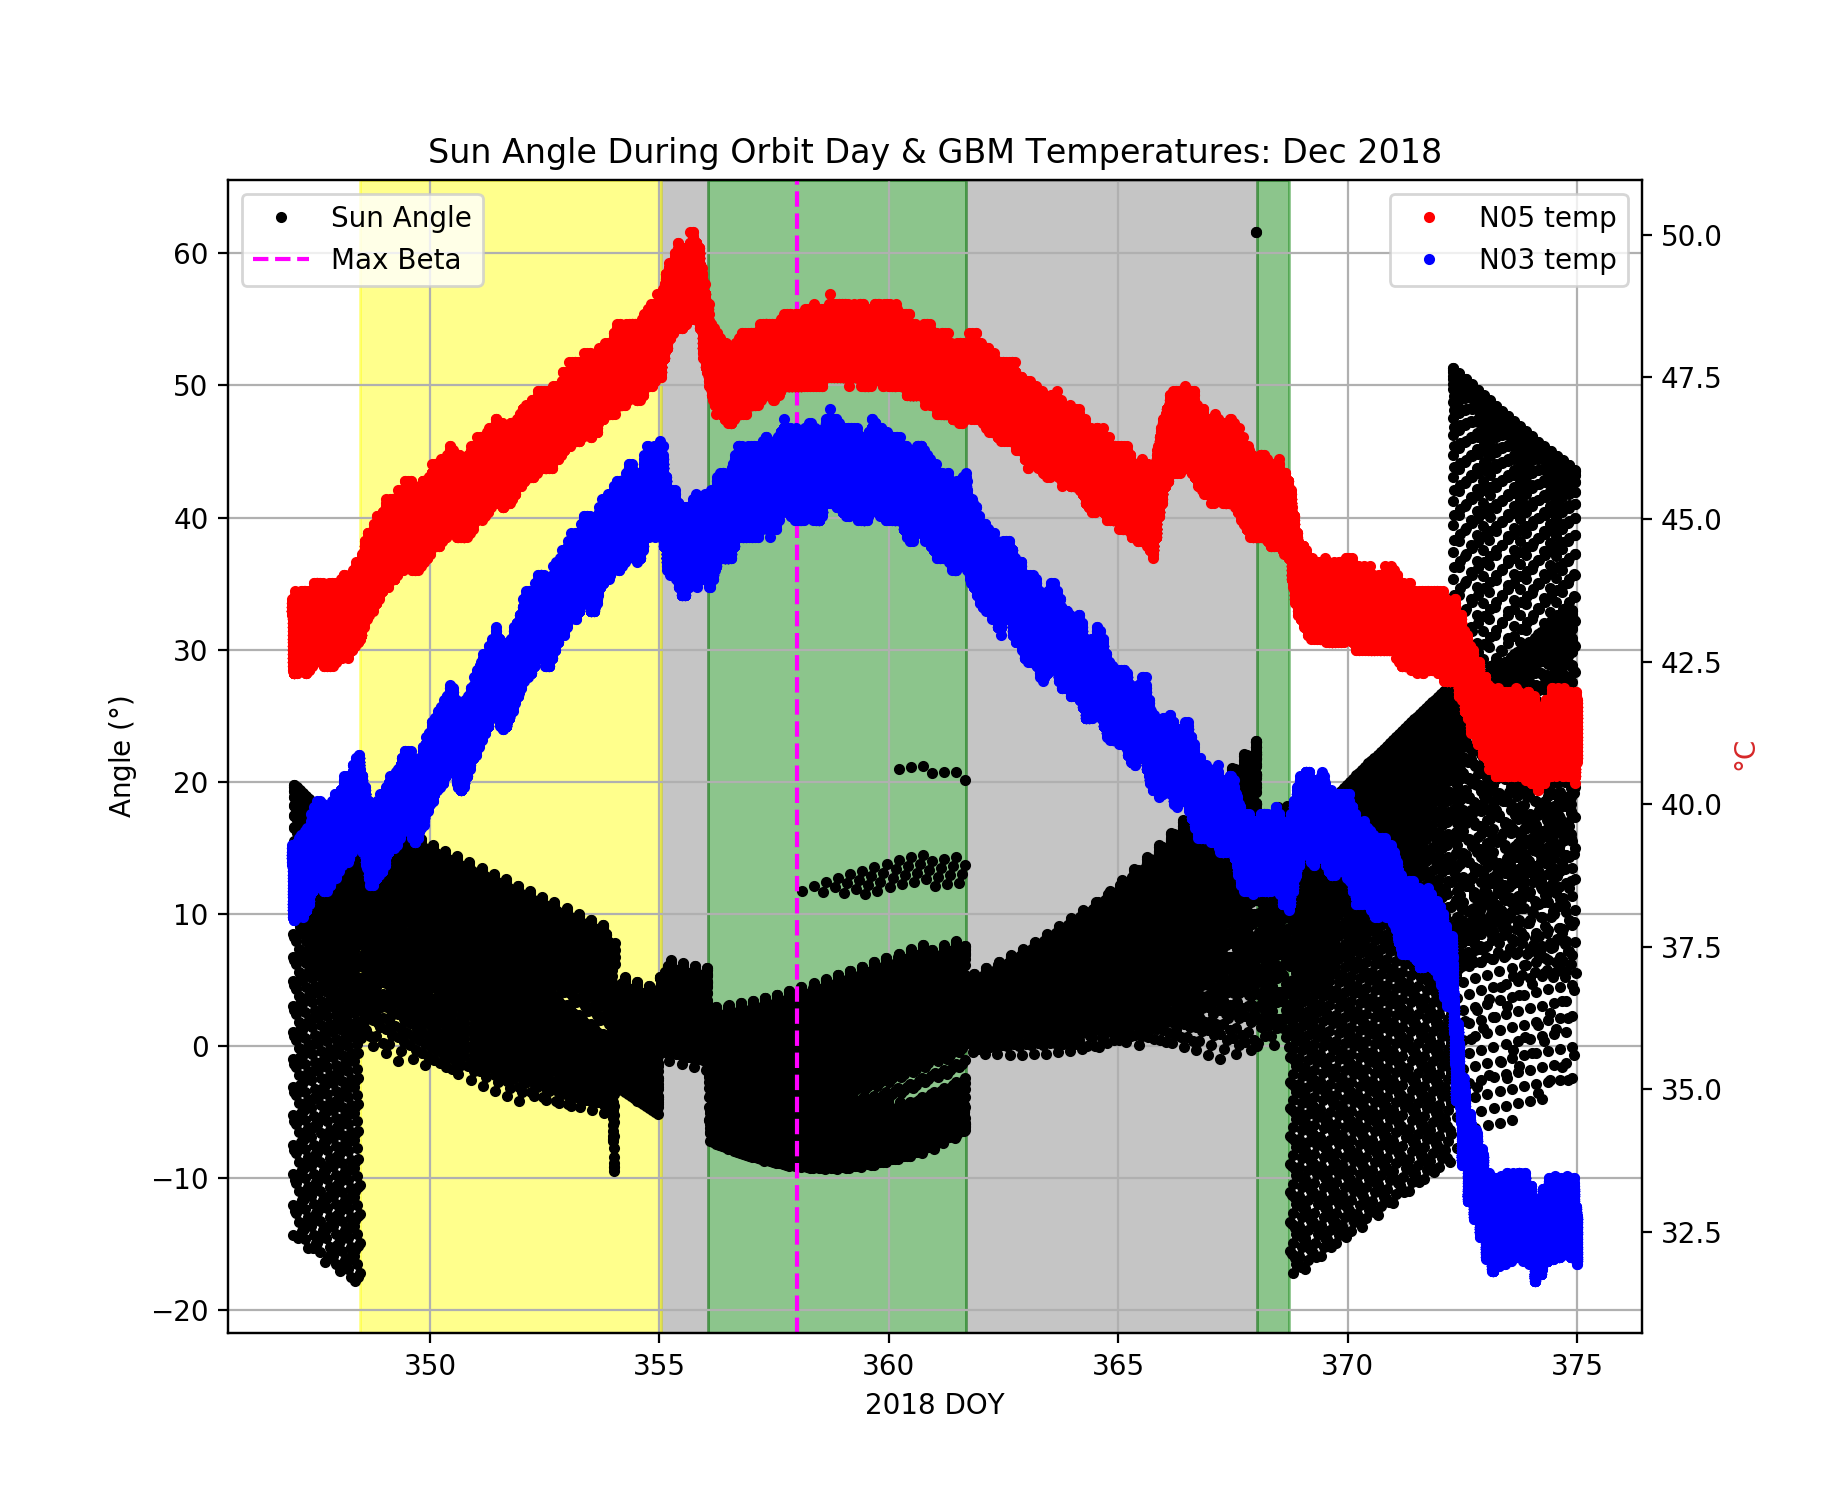
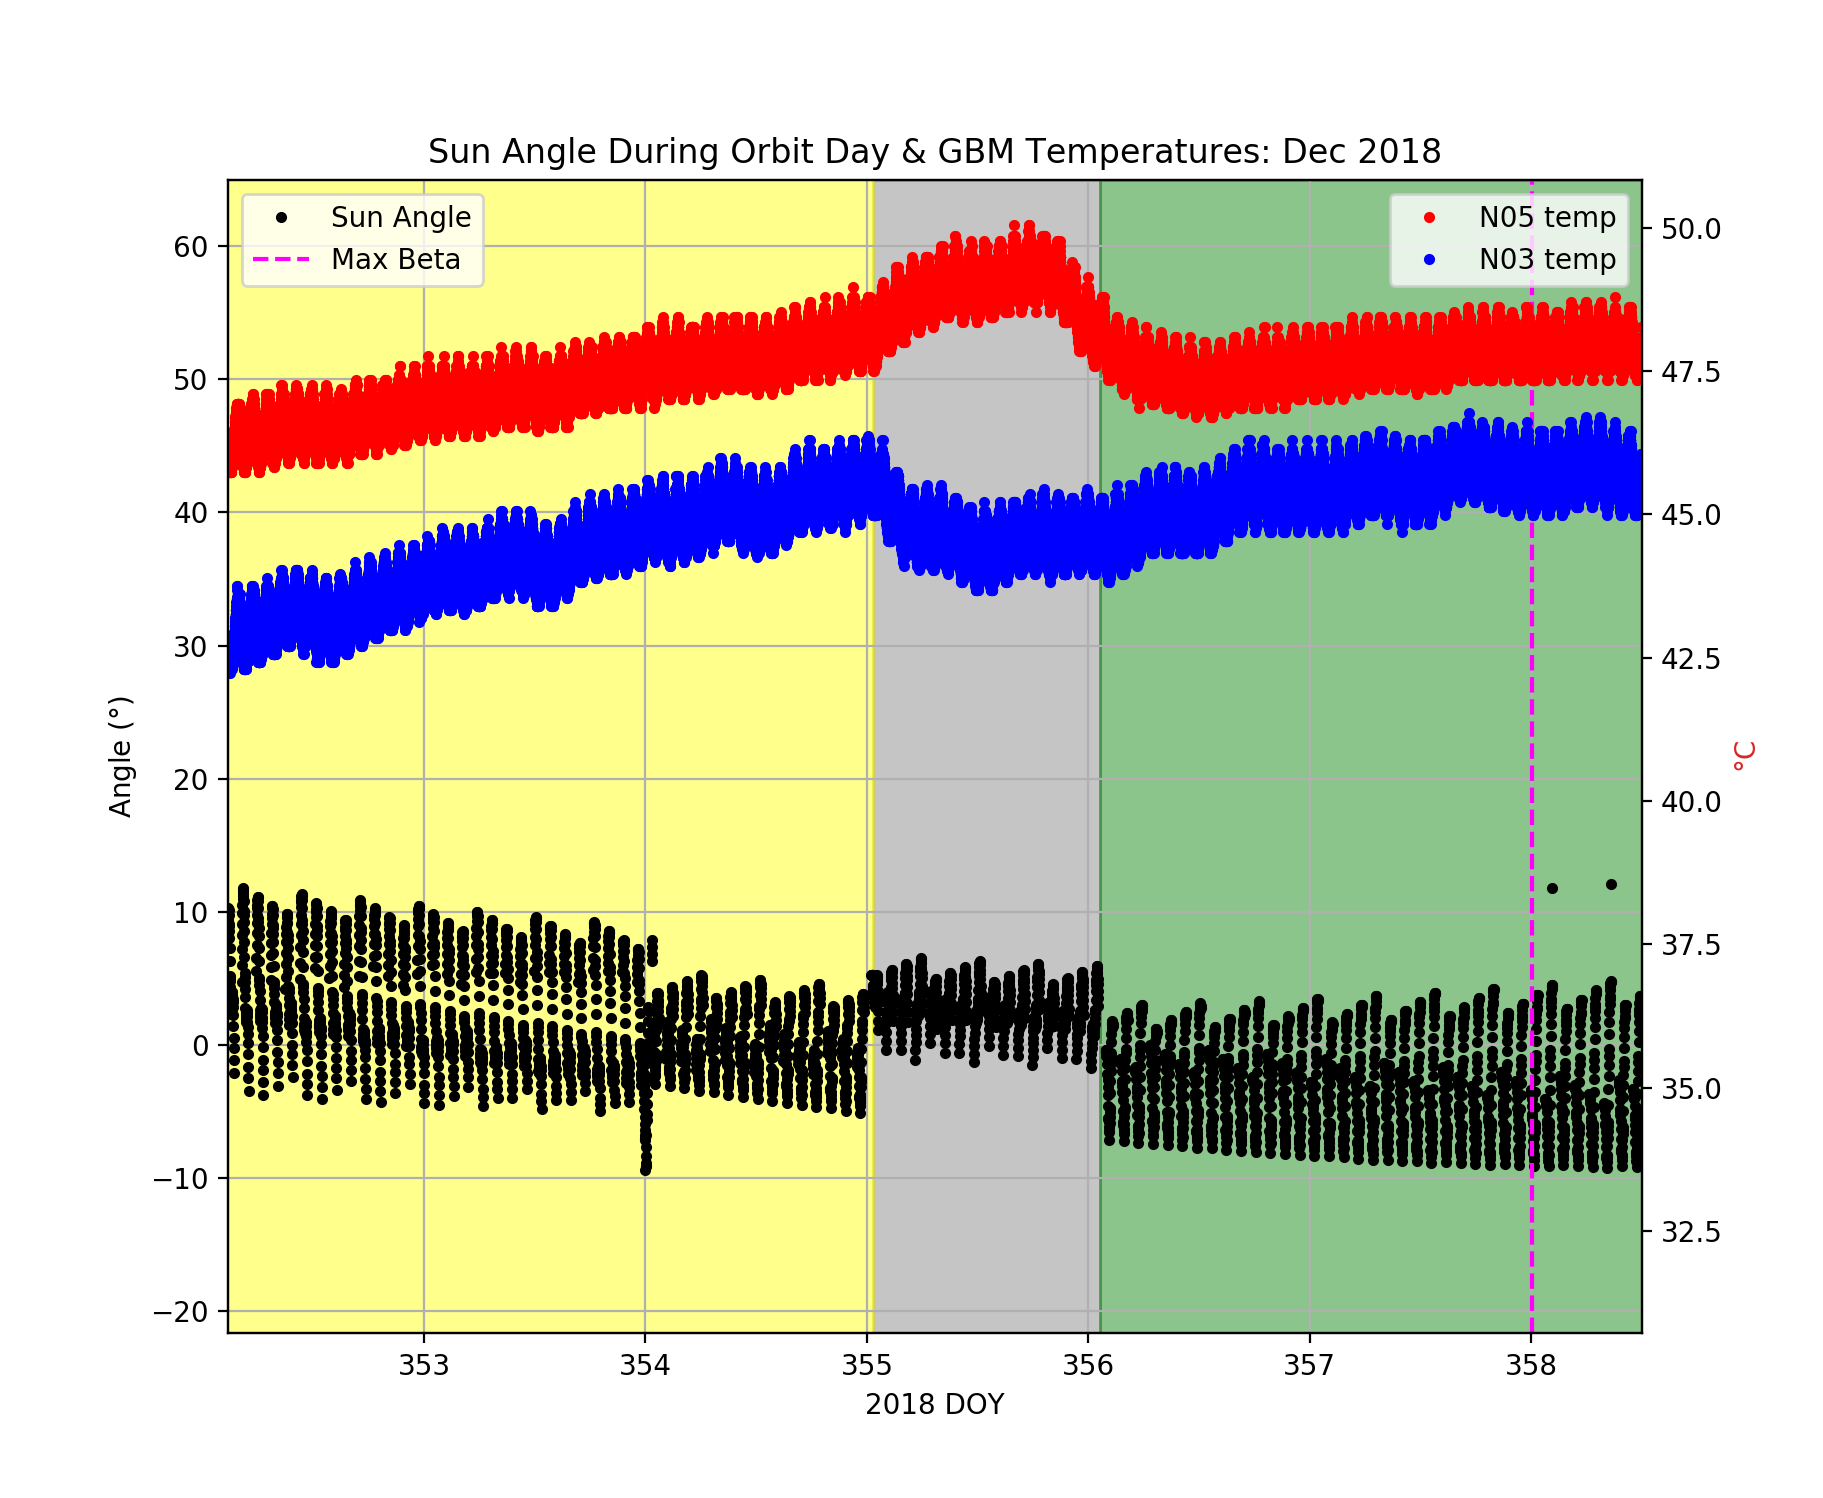
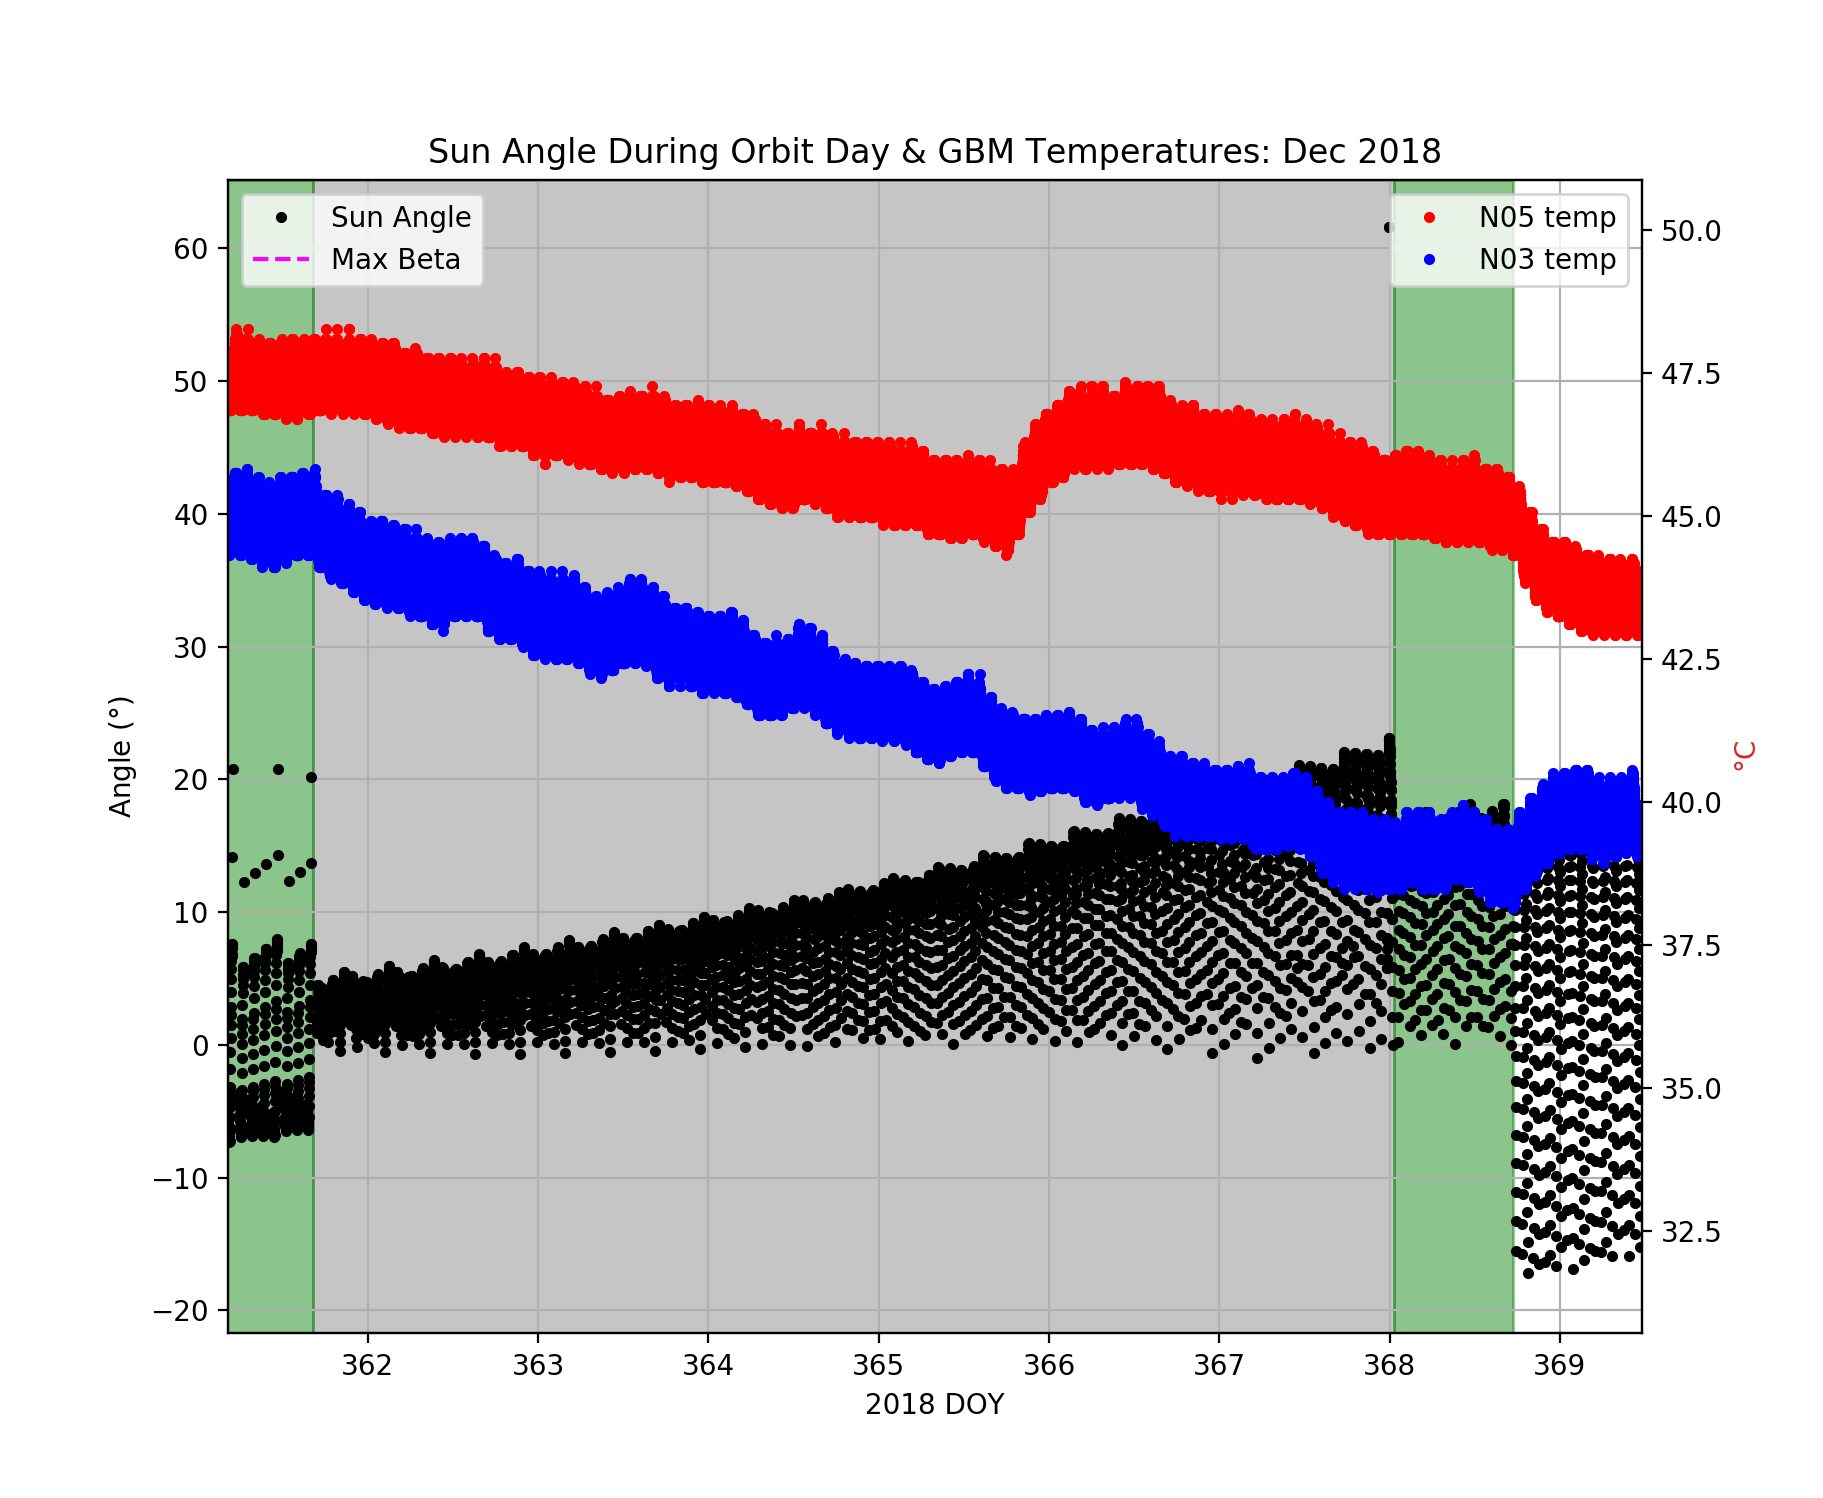
Shaded regions correspond to the various rocking strategies we employed during the associated period:
- Yellow: -50° full-sine profile (-50° sine during orbit day and +50° sine during orbit night)
- Green: -50° modified sine profile (-50° sine during orbit day then rocked 50° to the opposite hemisphere during orbit night)
- Grey: -42° modified sine profile (same as -50° mod-sine above, but with a lower amplitude sinusoid during orbit day)