GOAL
The goal of this project is to study and constrain the pair halo emission of AGN using the 2FHL catalog (E>50 GeV) and the preliminary results for the '3FHL' catalog.
People interested in the project:
Marco A., Alberto D. (add your name)
Links:
Data set:
Data set:
-P8R2_SOURCE_V6 80 months of data (MET 239557417 - 444440679)
-Energy: 50 GeV - 2 TeV and 10 GeV - 2 TeV
-Catalog version of 2FHL catalog FSSC version for the 3FHL catalog /u/gl/majello/ki06/P8_10GeV_80m/10GeV/cat_v2.fits
-Data cuts (note the lack of rocking angle cut):
gtselect zmax=105
gtmktime 'IN_SAA!=T&&DATA_QUAL==1&&LAT_CONFIG==1' and roicut=no
gtltcube zmax=105
-Location of the cleaned data (used for the paper) :
FT1 = /u/gl/majello/ki06/P8_10GeV_80m/Filtered/ft1-50GeV_p8_NOrockCut.fits
FT2 = /u/gl/majello/ki06/P8_10GeV_80m/P810GeV_80months-ft2-30s.fits
- LTCUBE: = /u/gl/majello/ki06/P8_10GeV_80m/ltcube_80m_Source_noRock_cut.fits
SOURCE SAMPLES
We have considered the 2FHL and the 3FHL catalog and we have created three different samples of sources.
| E>50 GeV | E>10 GeV |
|---|---|---|
Low z | all z<0.15 |b|>15 (39) | BL Lacs z<0.15 |b|>20 (43) |
High z | all z>0.4 |b|>15 (27) | BL Lacs z>0.70 |b|>20 (43) |
All | all with |b|>20 (198) | BL Lacs with |b|>20 (90) |
The three cases are labelled as "Low z", "High z" and "All" and the number of sources in each sample is reported in parenthesis.
2FHL: We have always considered all AGN and the most of them are BL Lacs
3FHL: We have considered only BL Lacs.
Therefore our catalog of sources is largely given by BL Lacs.
METHOD
Given the above listed samples we have simulated the Galactic diffuse gamma-ray emission, the isotropic diffuse and the emission from the selected sources.
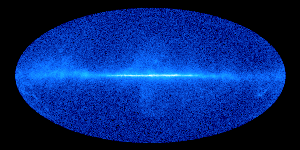
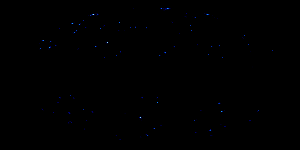
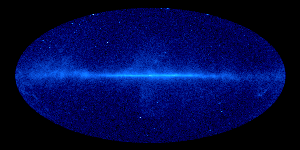
From left to right panel: Galactic diffuse emission, point sources and the merge of these maps.
For each sample we have performed 30 simulations and the result is averaged on them.
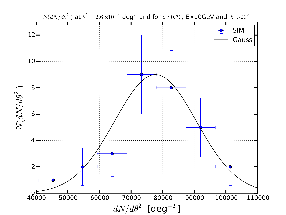
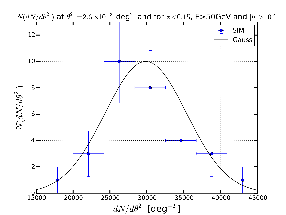
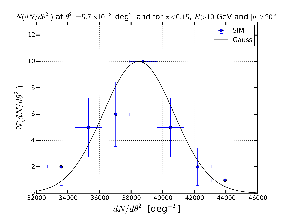
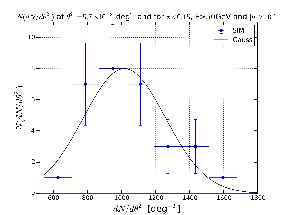
The observable that we have used is the Surface Brightness Profile (SBP) represented as dN/dtheta2 where theta is the offset angle with respect to the center of the sources. We have calculated the SBP for the real sky and the average for the 30 simulations. The average value of the SBP for each value of theta2 has been derived from the mean while the error is given by the standard deviation. This hypothesis is valid if the SBP for each value of is distributed with a Gaussian distribution. Below I show some examples that confirm this hypothesis is true.