19 July 2011
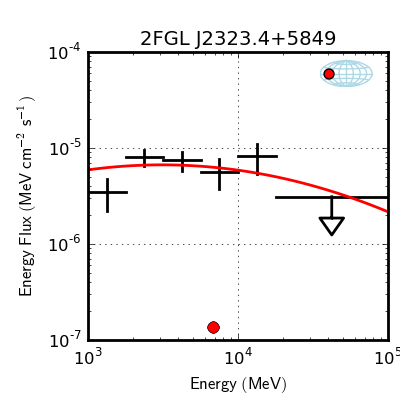
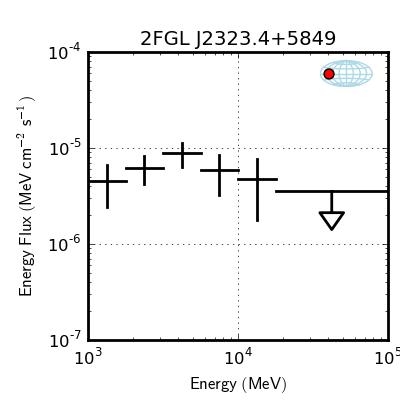
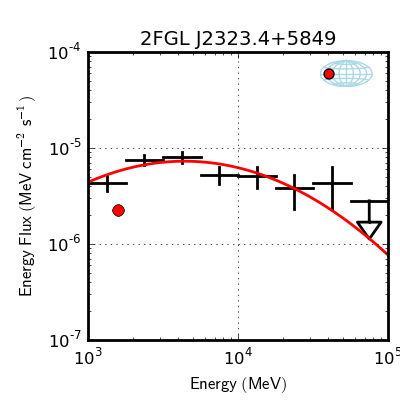
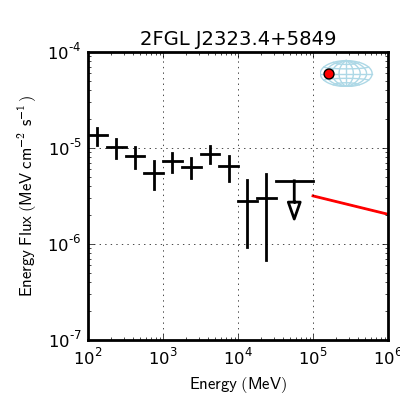
The following analysis of Cassiopeia A was done using pointlike with a 15 degree ROI and a LogParabola fit. The energy range used in the analysis is 100MeV to 100GeV, although the SEDs are shown only in the range of 1-100GeV since there is no reliable measure of their flux at lower energies.
Home directory: /u/st/ariel/cassa2FGL
The galactic diffuse model used: ring_2year_P76_v0.fits
The isotropic spectra models used: isotrop_2year_P76_source_v0.txt (For front and back events), isotrop_2year_P76_source_v0_front.txt (For front only events), isotrop_2year_P76_source_v0_back.txt (For back only events)
Catalog used: gll_psc_v04.fit
Instrument response function: P7SOURCE_V6
SEDs
|
1st half of time window
MET
Start = 239557417 seconds (2008-08-04T15:43:37)
Stop = 284206459 seconds (2010-01-03T10:14:19) |
2nd half of time window
MET
Start = 284206459 seconds (2010-01-03T10:14:19)
Stop = 328855431 seconds (2011-06-04T04:43:49) |
Full time window
MET
Start = 239557417 seconds (2008-08-04T15:43:37)
Stop = 328855431 seconds (2011-06-04T04:43:49) |
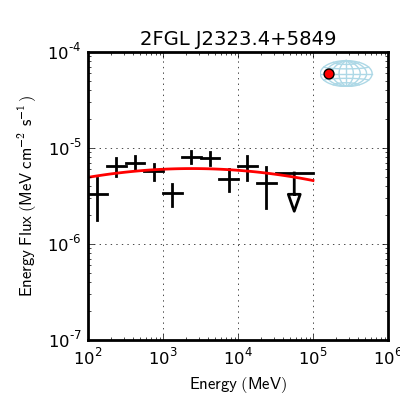
Front only events
|
Norm : 1.37e-13
Index : 2.15
beta : 0.0935
E_break : 6.78e+03
Ph. Flux : 3.68e-08 (DERIVED)
En. Flux : 5.77e-11 (DERIVED)
TS: 237.1 |
Norm : 4.51e-10
Index : 1.75
beta : 0.0394
E_break : 98.9
Ph. Flux : 5.28e-08 (DERIVED)
En. Flux : 7.58e-11 (DERIVED)
TS: 264.5 |
Norm : 5.83e-12
Index : 1
beta : 0.237
E_break : 659
Ph. Flux : 1.26e-08 (DERIVED)
En. Flux : 4.2e-11 (DERIVED)
TS: 508.4 |
Back only events
|
Norm : 1.15e-07
Index : 2.19
beta : 1.21e-08
E_break : 12.6
Ph. Flux : 1.05e-07 (DERIVED)
En. Flux : 1.08e-10 (DERIVED)
TS: 116.2 |
Norm : 9.31e-26
Index : 2.19
beta : 1.16e-09
E_break : 2.14e+09
Ph. Flux : 9.15e-08 (DERIVED)
En. Flux : 9.11e-11 (DERIVED)
TS: 94.629082599 |
Norm : 9.13e-11 (Failed fit)
Index : 1.16
beta : 0.16
E_break : 163 (Failed fit)
Ph. Flux : 3.43e-08 (DERIVED)
En. Flux : 4.99e-11 (DERIVED)
TS: 213.2 |
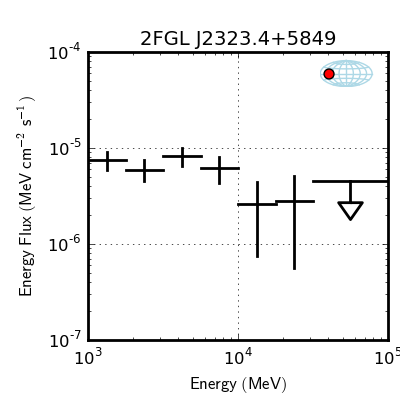
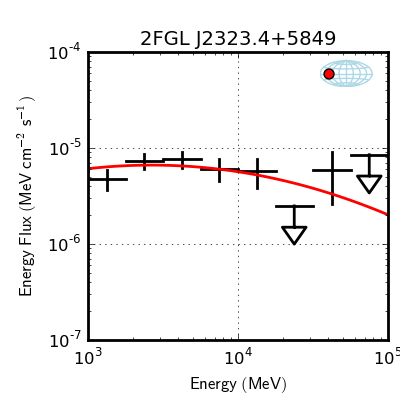
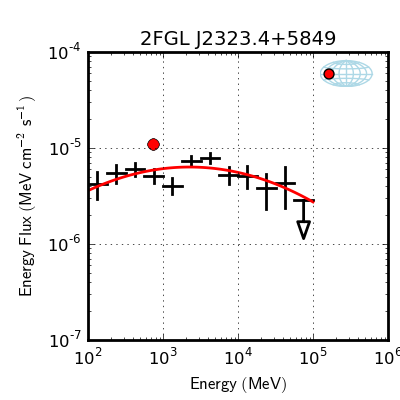
Front and back events
|
Norm : 3.29e-11
Index : 1.65
beta : 0.0904
E_break : 378
Ph. Flux : 3.96e-08 (DERIVED)
En. Flux : 5.75e-11 (DERIVED)
TS: 330.2 |
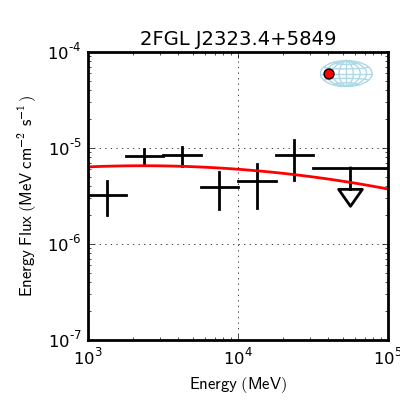
Norm : 4.02e-14
Index : 2.14
beta : 0.0285
E_break : 1.15e+04
Ph. Flux : 5.83e-08 (DERIVED)
En. Flux : 7.51e-11 (DERIVED)
TS: 358.6
|
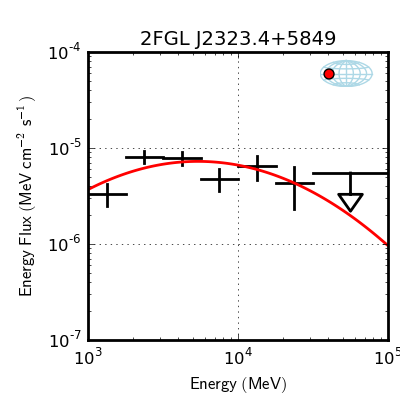
Norm : 2.26e-12
Index : 1.53
beta : 0.23
E_break : 1.6e+03
Ph. Flux : 1.56e-08 (DERIVED)
En. Flux : 4.28e-11 (DERIVED)
TS: 676.030199235 |
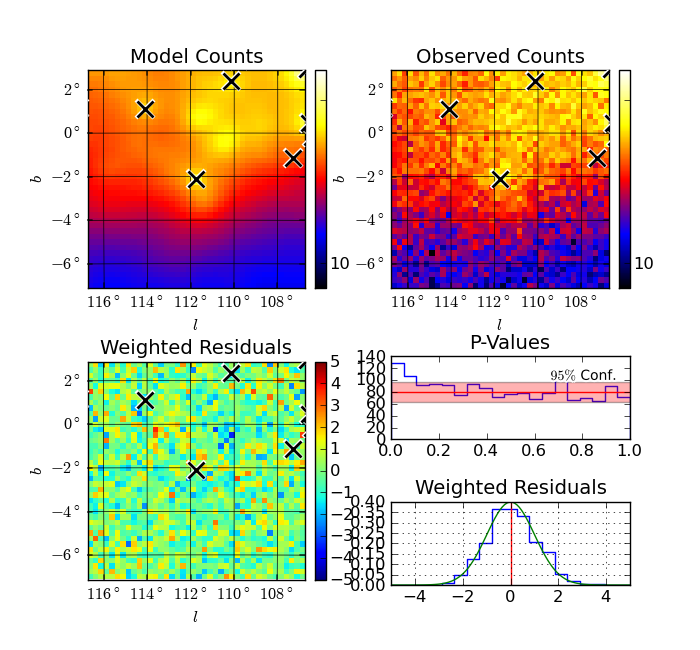
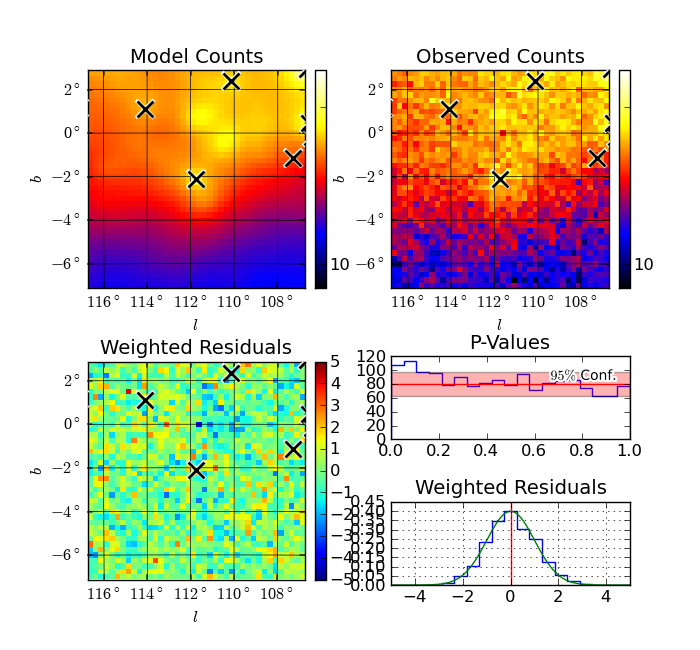
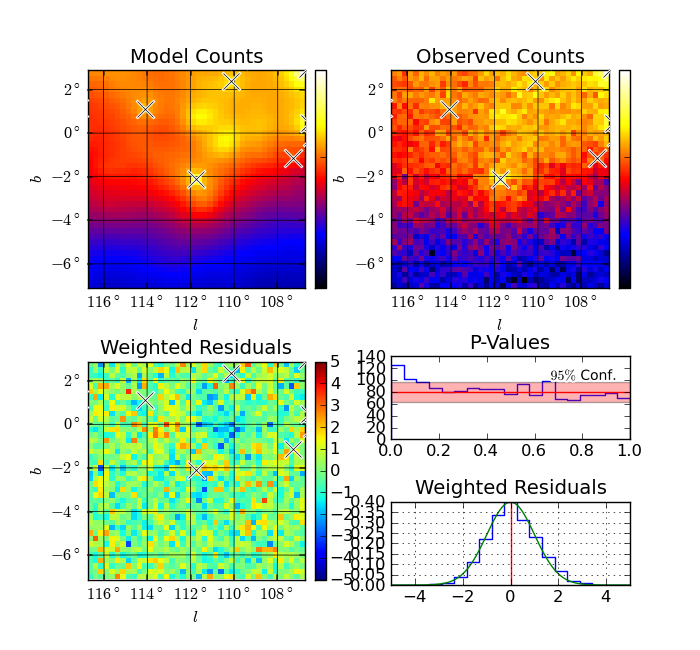
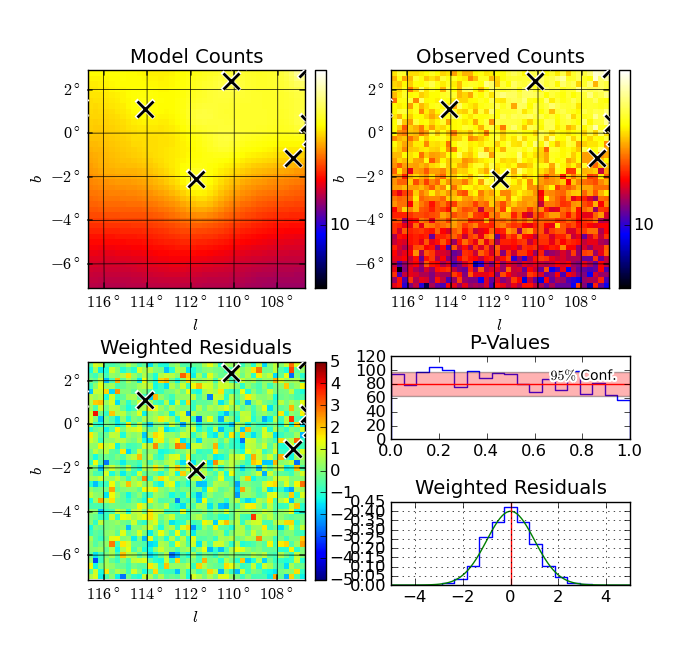
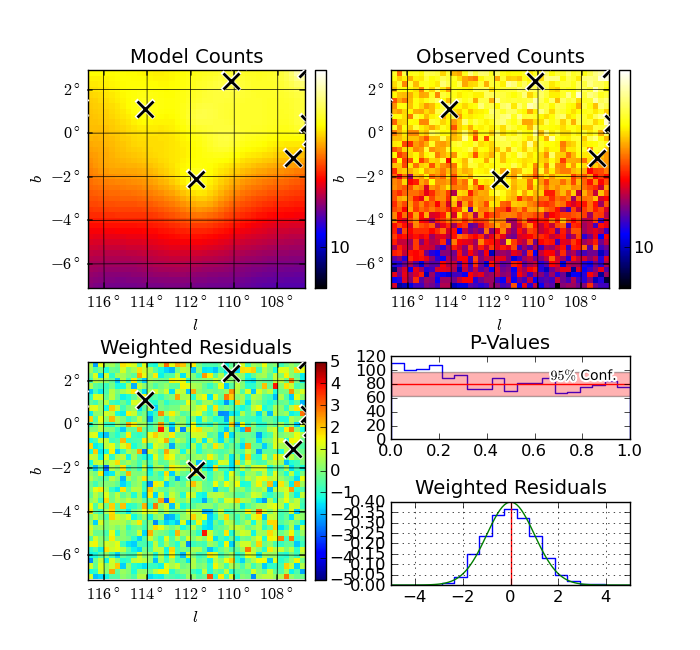
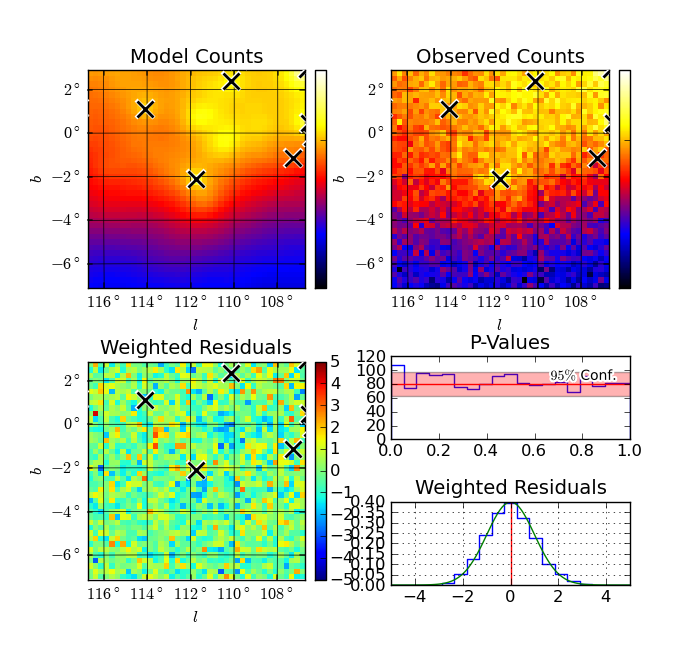
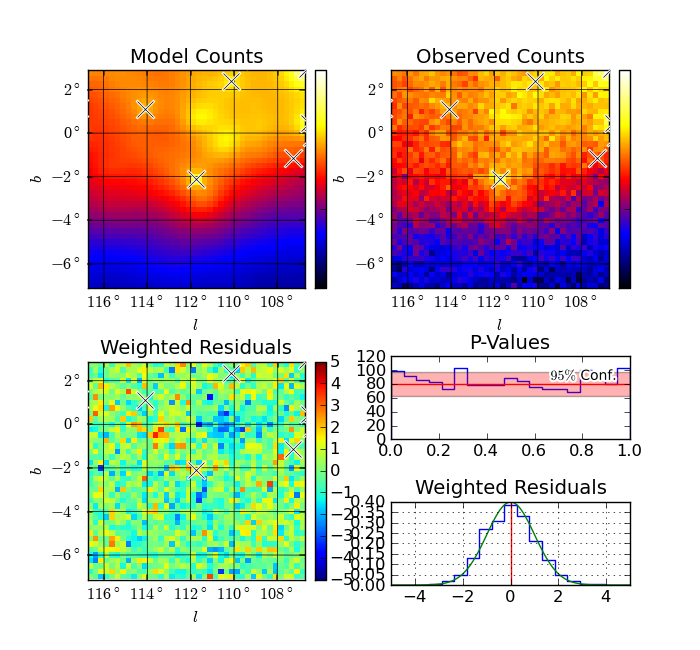
The following counts maps were also done in pointlike.
Counts maps
|
1st half of time window
MET
Start = 239557417 seconds (2008-08-04T15:43:37)
Stop = 284206459 seconds (2010-01-03T10:14:19) |
2nd half of time window
MET
Start = 284206459 seconds (2010-01-03T10:14:19)
Stop = 328855431 seconds (2011-06-04T04:43:49) |
Full time window
MET
Start = 239557417 seconds (2008-08-04T15:43:37)
Stop = 328855431 seconds (2011-06-04T04:43:49) |
Front only events |
|
|
|
Back only events |
|
|

|
Front and back events |
|

|
|
Observations
1) The analysis was done with separate isotropic spectra files for the front and back of Fermi to check to see if both observation sets overlapped on a particular source.
2) The analysis was also done with two different time windows to try and get a statistical check on any of the features observed in the SEDs for the full timeframe.
20 July 2011
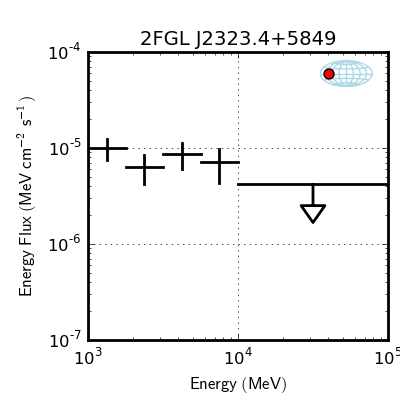
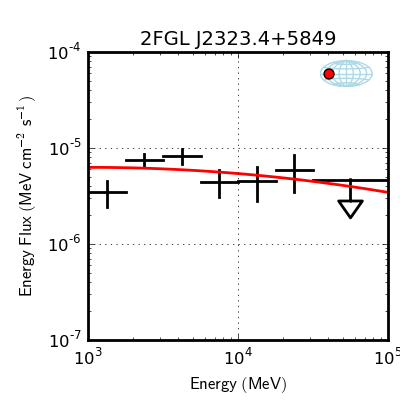
Between 100MeV and 1GeV there appears to be significant variation in the flux observed by the Fermi satellite depending on which type of events (Front, back, or both) are used in producing the SEDs. The SEDs, using close to three years of observation data, are as follows:
Full time window
MET
Start = 239557417 seconds (2008-08-04T15:43:37)
Stop = 328855431 seconds (2011-06-04T04:43:49) |
Back only events
|
Front only events
|
Both
|
|
|
|
Norm : 6.25e-12
Index : 0.976
beta : 0.24
E_break : 635
Ph. Flux : 1.3e-08
En. Flux : 4.33e-11
TS: 412.8
|