You are viewing an old version of this page. View the current version.
Compare with Current
View Page History
« Previous
Version 6
Next »
19 July 2011
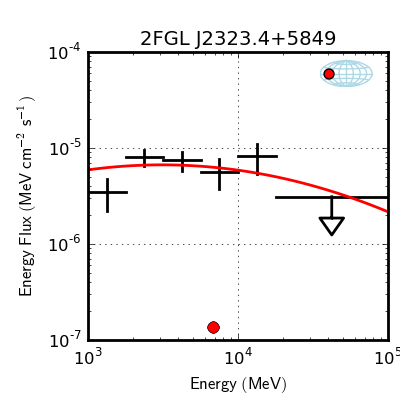
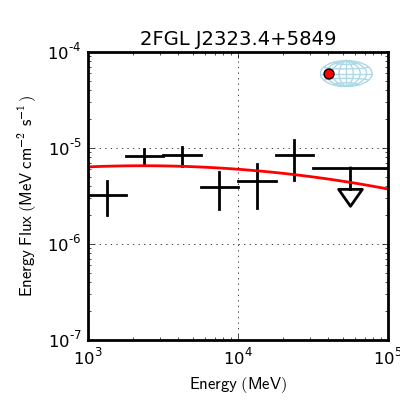
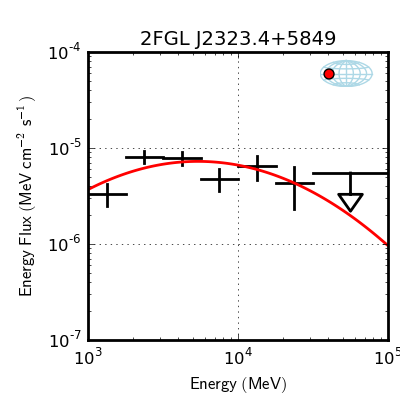
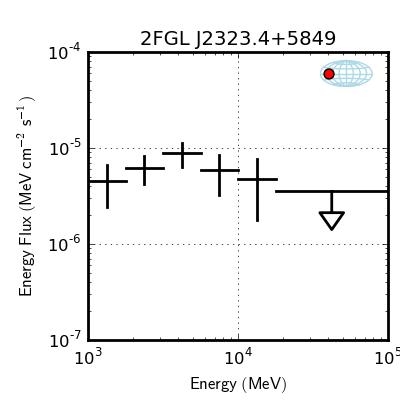
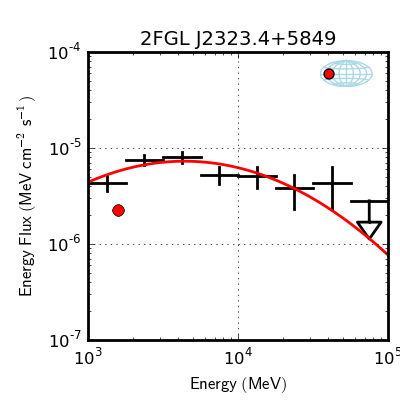
The following analysis of Cassiopeia A was done using pointlike with a 15 degree ROI and a LogParabola fit. The energy range used in the analysis is 100MeV to 100GeV, although the SEDs are shown only in the range of 1-100GeV since there is no reliable measure of their flux at lower energies.
Home directory: /u/st/ariel/cassa2FGL
The galactic diffuse model used: ring_2year_P76_v0.fits
The isotropic spectra models used: isotrop_2year_P76_source_v0.txt (For front and back events), isotrop_2year_P76_source_v0_front.txt (For front only events), isotrop_2year_P76_source_v0_back.txt (For back only events)
Catalog used: gll_psc_v04.fit
Instrument response function: P7SOURCE_V6
SEDs
|
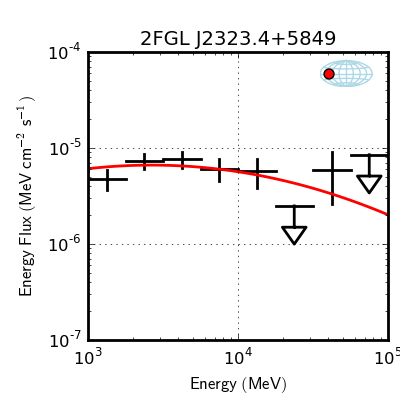
1st half of time window
MET
Start = 239557417 seconds (2008-08-04T15:43:37)
Stop = 284206459 seconds (2010-01-03T10:14:19) |
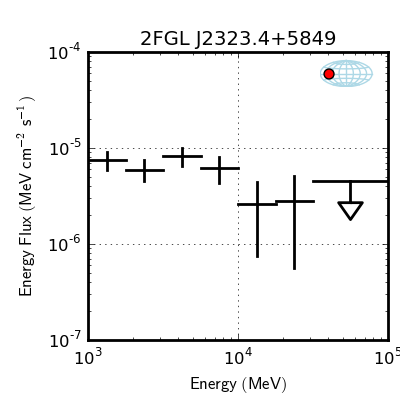
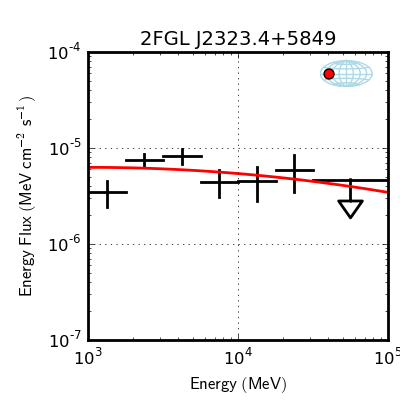
2nd half of time window
MET
Start = 284206459 seconds (2010-01-03T10:14:19)
Stop = 328855431 seconds (2011-06-04T04:43:49) |
Full time window
MET
Start = 239557417 seconds (2008-08-04T15:43:37)
Stop = 328855431 seconds (2011-06-04T04:43:49) |
Front only events
|
Norm : 1.37e-13
Index : 2.15
beta : 0.0935
E_break : 6.78e+03
Ph. Flux : 3.68e-08 (DERIVED)
En. Flux : 5.77e-11 (DERIVED)
|
Norm : 4.51e-10
Index : 1.75
beta : 0.0394
E_break : 98.9
Ph. Flux : 5.28e-08 (DERIVED)
En. Flux : 7.58e-11 (DERIVED)
|
Norm : 5.83e-12
Index : 1
beta : 0.237
E_break : 659
Ph. Flux : 1.26e-08 (DERIVED)
En. Flux : 4.2e-11 (DERIVED)
|
Back only events
|
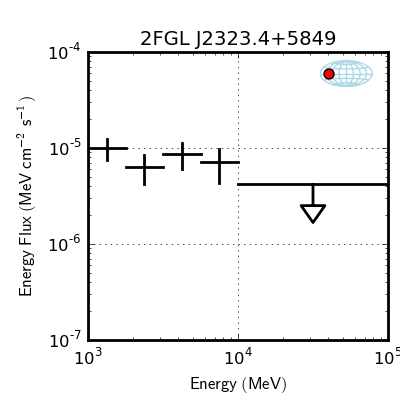
Norm : 1.15e-07
Index : 2.19
beta : 1.21e-08
E_break : 12.6
Ph. Flux : 1.05e-07 (DERIVED)
En. Flux : 1.08e-10 (DERIVED)
|
Norm : 9.31e-26
Index : 2.19
beta : 1.16e-09
E_break : 2.14e+09
Ph. Flux : 9.15e-08 (DERIVED)
En. Flux : 9.11e-11 (DERIVED)
|
Norm : 9.13e-11 (Failed fit)
Index : 1.16
beta : 0.16
E_break : 163 (Failed fit)
Ph. Flux : 3.43e-08 (DERIVED)
En. Flux : 4.99e-11 (DERIVED)
|
Front and back events
|
Norm : 3.29e-11
Index : 1.65
beta : 0.0904
E_break : 378
Ph. Flux : 3.96e-08 (DERIVED)
En. Flux : 5.75e-11 (DERIVED)
TS: 330.185871526 |
Norm : 4.02e-14
Index : 2.14
beta : 0.0285
E_break : 1.15e+04
Ph. Flux : 5.83e-08 (DERIVED)
En. Flux : 7.51e-11 (DERIVED)
|
Norm : 2.26e-12
Index : 1.53
beta : 0.23
E_break : 1.6e+03
Ph. Flux : 1.56e-08 (DERIVED)
En. Flux : 4.28e-11 (DERIVED)
|
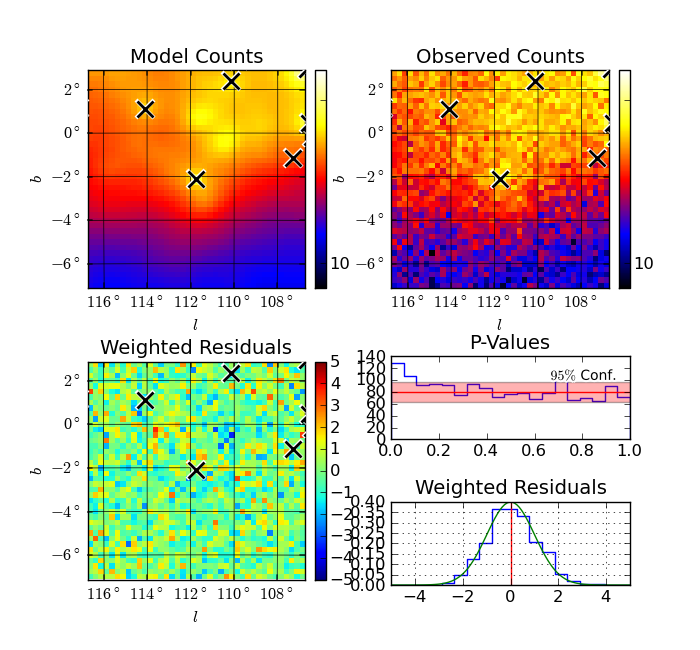
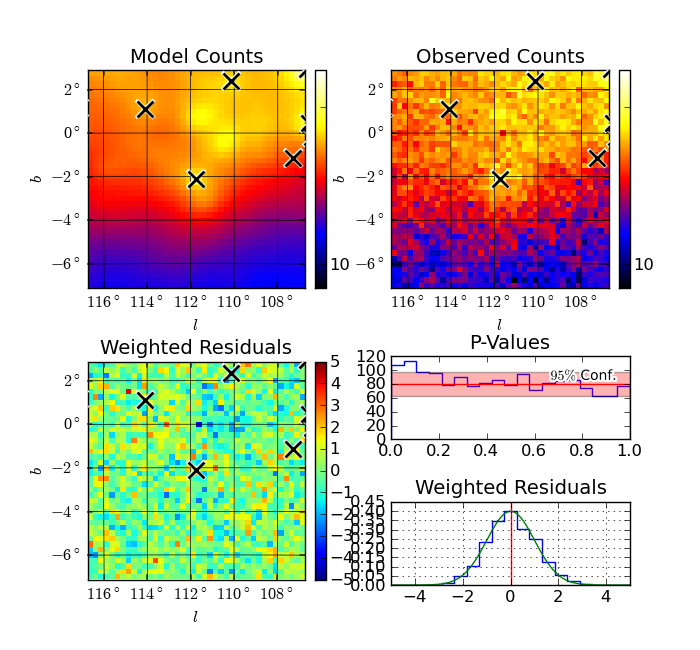
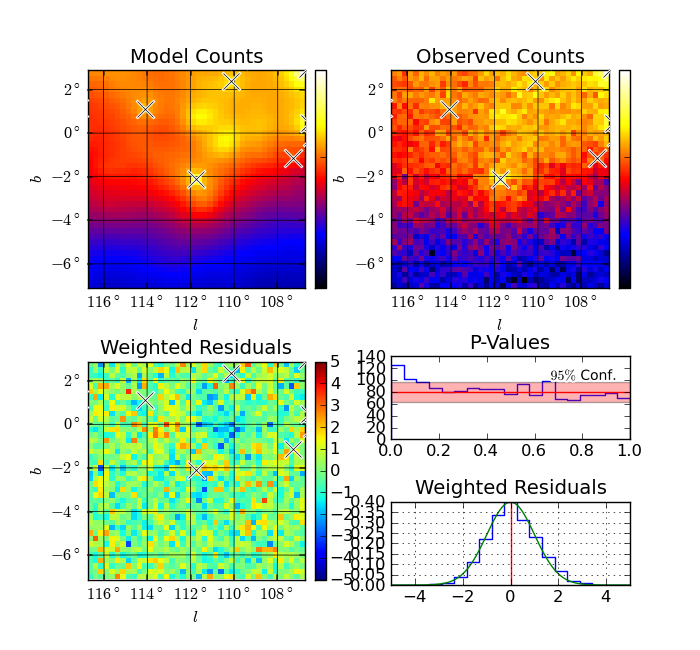
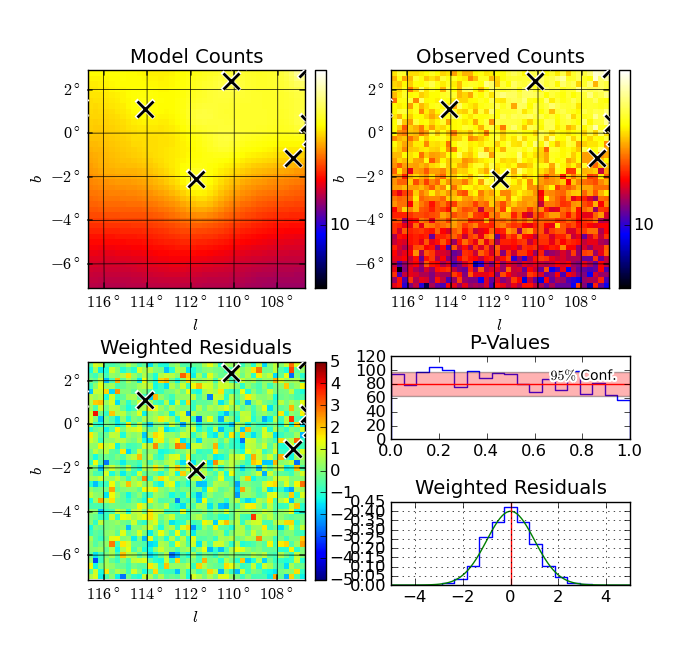
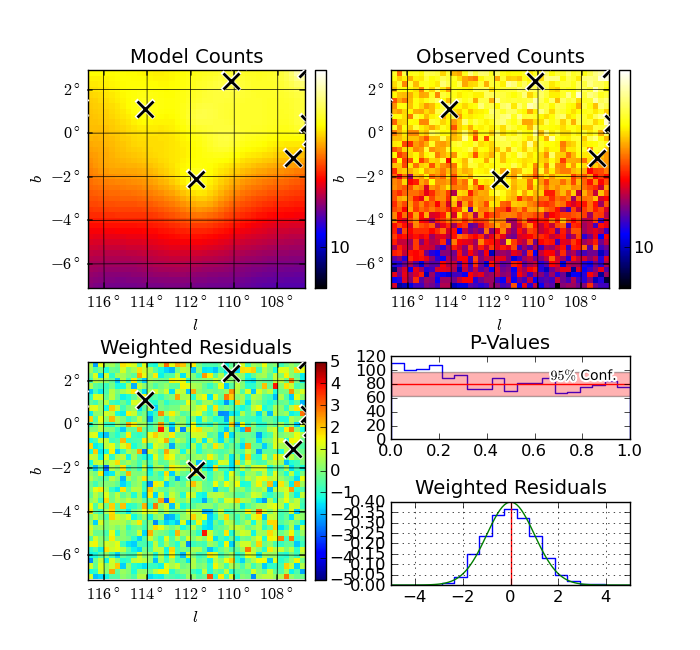
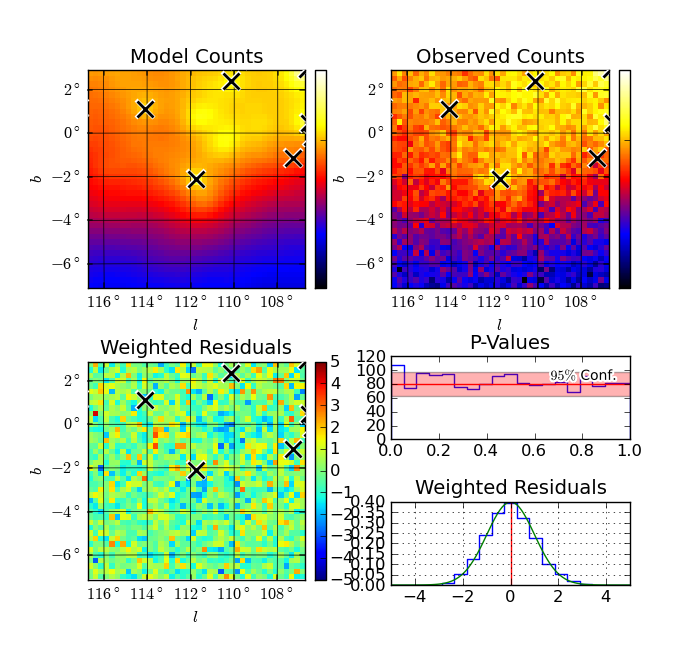
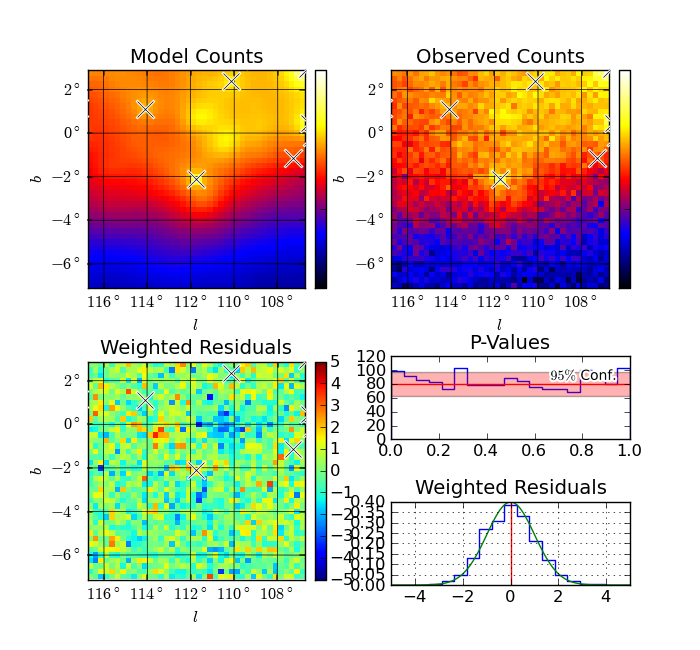
The following counts maps were also done in pointlike.
Counts maps
|
1st half of time window
MET
Start = 239557417 seconds (2008-08-04T15:43:37)
Stop = 284206459 seconds (2010-01-03T10:14:19) |
2nd half of time window
MET
Start = 284206459 seconds (2010-01-03T10:14:19)
Stop = 328855431 seconds (2011-06-04T04:43:49) |
Full time window
MET
Start = 239557417 seconds (2008-08-04T15:43:37)
Stop = 328855431 seconds (2011-06-04T04:43:49) |
Front only events |
|
|
|
Back only events |
|
|

|
Front and back events |
|

|
|
Observations
1) The analysis was done with separate isotropic spectra files for the front and back of Fermi to check to see if both observation sets overlapped on a particular source.
2) The analysis was also done with two different time windows to try and get a statistical check on any of the features observed in the SEDs for the full timeframe.