![]() Update: Jean explained the difference between his plots and mine. The catalog pipeline limits the spectral index of the PL fit to the flux-in-band data to 0<Γ<5. This is done to avoid arbitrarily large indexes in the case of exponential cutoffs.
Update: Jean explained the difference between his plots and mine. The catalog pipeline limits the spectral index of the PL fit to the flux-in-band data to 0<Γ<5. This is done to avoid arbitrarily large indexes in the case of exponential cutoffs.
This page describes my efforts to draw flux-in-band spectral plots for 2FGL sources that have curved spectral models (in particular the super exponential). For curved spectra, I have been unable to reproduce the plots that Jean posted. In particular I concentrate on the plot for PSR J0007+7307 / 2FGL J0007.0+7303.
The spectra plots for this source are shown below, with my plot shown on the left and Jean's on the right.
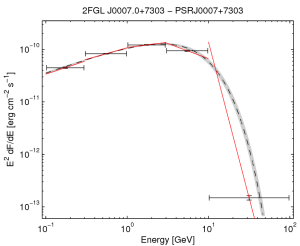
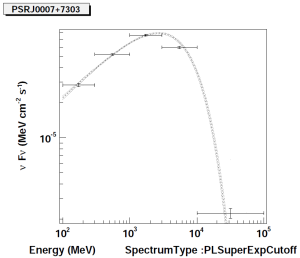
It can be seen that the highest energy point is significantly different in the two plots. On my plot the point is below the line indicating the exponentially-cutoff power-law (PLEXP) model, and has an E^2dN/dE flux of 1.5E-13 erg/cm^2/s (or 9.2E-8 MeV/cm^2/s). On Jean's plot the point lies above the PLEXP curve and has a flux of approximately 2.2E-6 MeV/cm^2/s, a factor of approximately 20 larger than on my plot.
In the gll_pscP72Y_v2r1 FITS file this spectral point has:
- Energy range: 10 GeV - 100 GeV
- Mid point in log energy: 31.6 GeV
- Integral flux: 1.25e-09 (ph/cm^2/s)
- Flux error: 0.12e-09 (ph/cm^2/s)
- TS: 731.9
- Npred: 122.7
The integral flux is calculated from a fit to the energy band using a power law with index given by the index of the global PLEXP function at the mid point energy. The parameters of the PLEXP function are:
- Low energy index: 1.45
- Cutoff energy: 4.87 GeV
The slope of the exponential as a function of energy is then: Γ(E) = 1.45+E/4.87GeV. At the middle of the highest energy band this is Γ(31.6GeV)=7.94. A power law with this slope and integral flux given above has a flux constant at the middle of the energy band of N_0_=1.25e-09*(7.94-1)/31.6/[(10/31.6)1-7.94-(100/31.6)1-7.94]=9.35e-14 ph/cm^2/s/GeV, i.e.
- dN/dE = 9.35e-14 (E/31.6GeV)-7.94 ph/cm^2/s/GeV
This power law is depicted on my plot as a red power law covering the range 10-100 GeV (the PL fits from the other bands are also shown). Numerically integrating the red PL function also gives 1.25e-09. Calculating E^2dN/dE at the mid point gives 31.6^2*9.3e-14 = 9.3e-11 GeV/cm^2/s = 1.5 erg/cm^2/s, in agreement with the point depicted on my plot.
This discrepancy is present between Jean's and my plots for all the PLEXP models, for points above the cutoff energy. Flux points for sources with power-law spectra look to agree. I have not studied the LOGP models in much detail. Further examples of PLEXP sources with significant highest energy points are shown below.
| There are no images attached to this page. |