This page describes my efforts to draw flux-in0-band spectral plots for 2FGL sources that have curved spectral models (in particular the super exponential). For curved spectra, I have been unable to reproduce the plots that Jean posted. In particular I concentrate on the plot for PSR J0007+7307 / 2FGL J0007.0+7303.
The spectra plots for this source are shown below: my first effory (left) and Jean's (right).
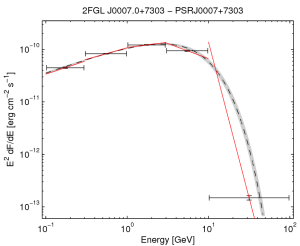
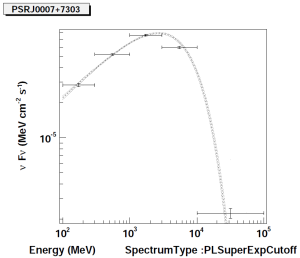
It can be seen that the highest energy point is significantly different in the two plots. On my plot the point is below the line indicating the PLEXP model, and has an E2dF/dE flux of 1.5E-13 erg/cm^2/s (or 9.2E-8 MeV/cm^2/s). On Jean's plot the point lies above the PLEXP curve and has a flux of approximately 2.2E-6 MeV/cm^2/s.