Introduction
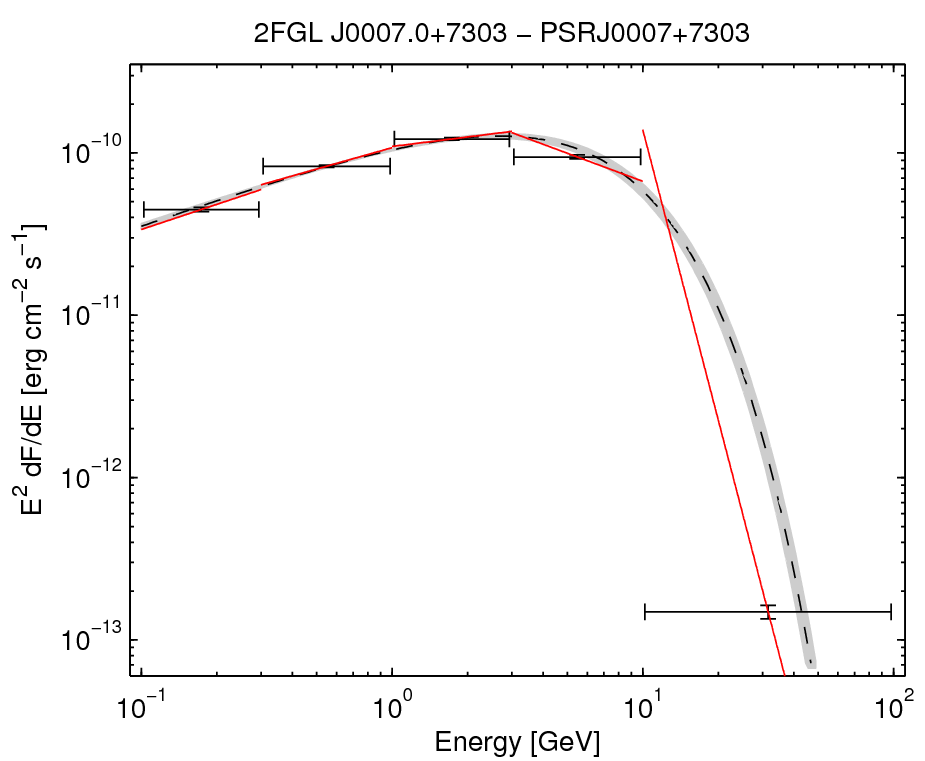
This page describes my efforts to draw flux-in0-band spectral plots for 2FGL sources that have curved spectral models (in particular the super exponential). For curved spectra, I have been unable to reproduce the plots that Jean posted. In particular I concentrate on the plot for PSR J0007+7307 / 2FGL J0007.0+7303.