California Counties Motion Charts of Covid-19 deaths vs confirmed cases
bubbles sized by population density for CA Counties and colored by per capita income (Jan 25, 2020 - Apr 30, 2020)
cases per million population with bubbles sized by CA county population and colored by per capita income (May 1, 2020 - Jun 25, 2020)
California by County every 5 days colored by per capita income | Californa by county every 5 days colored by % Hispanic in county Low<0-33.4%, medium>=33.4%-<37.8%, high>= 37.8% |
|---|---|
 |  |
Observations:
- Deaths are roughly linear with confirmed cases on a log scale
- By March 24th the following counties were already observing deaths: Santa Clara (SCL), Riverside (RIV), San Jose (SJ), Sacramento (SAC), LA County, Orange County.
- By June 25th:
- In terms of confirmed cases and deaths per 1 Million county population
- The leading counties were Lake (LAK), Nevada (NEV), Mono (MNO) with Imperial (IMP) catching up since the end of May.
- These are followed by LA County (LA), Orange Country (OR), Kings County (KIN), Tuolumne (TUO) and Riverside (RIV).
- If one just takes the number of cases (i.e. do not normalize by the population of the county) then:
- The leading counties are LA County (LA), Orange County (OR), Lake County (LAK), Nevada County (Nevada), Riverside (RIV), San Diego County (SD) and San Bernadino County (SBD)
- In general, the counties with lower per capita income appear to have lower numbers of confirmed cases and deaths, The exceptions are Lake County (LAK), Imperial County (IMP), Kern County (KER), Tuolumne County (TUO) and Fremont County (FRE).
- In terms of confirmed cases and deaths per 1 Million county population
- By July 20:
- LA county, Orange county (ORA), Lake, Riverside (RIV), San Diego (SD) and San Bernadino (SBD) counties by July 20 had a clear lead in deaths and confirmed cases.
- By this time LA county had almost four times the deaths of the next highest (Orange) county and almost three times the confirmed cases.
- The following counties still had zero deaths:
| County | ID | Covid-19 confirmed | deaths | Population() | %Hispanic Population |
| Alpine | ALP | 2 | 0 | 1202 | 7% |
| Amador | AMA | 57 | 0 | 37159 | 12.2% |
| Calaveras | CAL | 87 | 0 | 44921 | 10.2% |
| Colusa | COL | 223 | 0 | 21424 | 53.8% |
| El Dorado | ED | 443 | 0 | 181465 | 11.8% |
| Lassen | LAS | 512 | 0 | 33356 | 17.4% |
| Plumas | PLU | 24 | 0 | 19286 | 8% |
| Sierra | SIE | 22 | 0 | 3019 | 7.5% |
| Siskiyou | SIS | 50 | 0 | 44261 | 10.2% |
| Trinity | TRI | 104 | 0 | 13515 | 6.7% |
| Tuolumne | TUO | 101 | 0 | 54347 | 10.5% |
- Imperial county with a population of 177K had 8606 cases and 163 deaths, this compares with El Dorado county with a population of 181K that had 443 cases and 0 deaths.
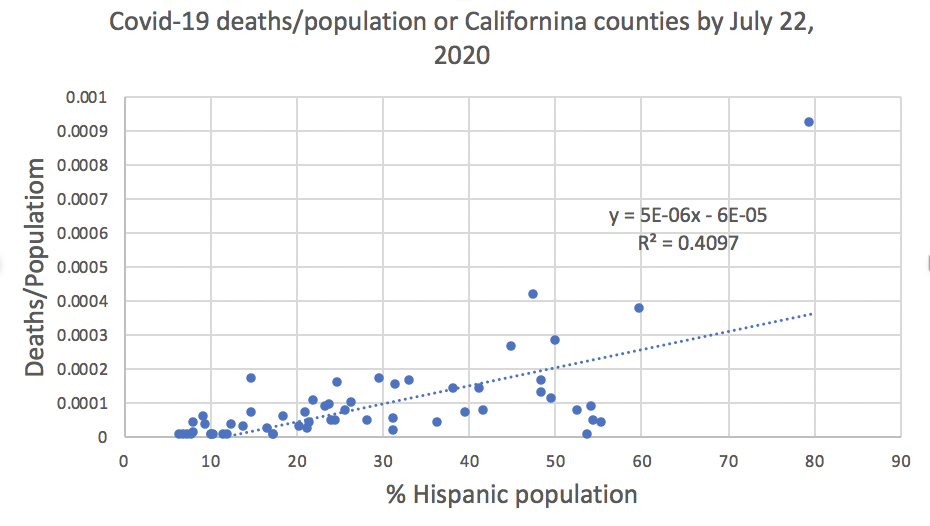
The following were the leading counties in terms of deaths/population
County ID Confirmed Deaths Population Deaths/population % Hispanic population Riverside RIV 29983 588 2266899 0.000259 45% KIngs KIN 3398 42 151390 0.000277 50.2% Tulare TUL 6896 167 451108 0.000370 59.8% Los Angeles LA 159045 4104 9974203 0.000411 47.5% Imperial IMP 8606 163 177026 0.000921 79.6% It is seen that these leading counties also had large Hispanic populations. Graphs of the ratios confirmed cases/population and deaths/population against the per cent of Hispanic population in each California county areshown below, There are seen to be noticeable correlations (R^2). The probability of a confirmed case is seen to be over a factor of two greater for counties with twice the percentage of Hispanic populations.

The following were the leading counties in terms of deaths/confirmed cases:
County ID Deaths/confirmed % Population % Hispanic population Inyo INY 2.5 18439 18.7% San Mateo SM 2.5 739837 24.9% Los Angeles LA 2.58 9974203 47.5% Mariposa MPA 2.63 17946 9.4% Yolo YOL 2.84 204162 29.8% Shasta SHA 2.89 178520 8.3%