...
- Top left: CTBCORE. Overlayed events have lots of events at low CTBCORE. This should be due to the events with low energy
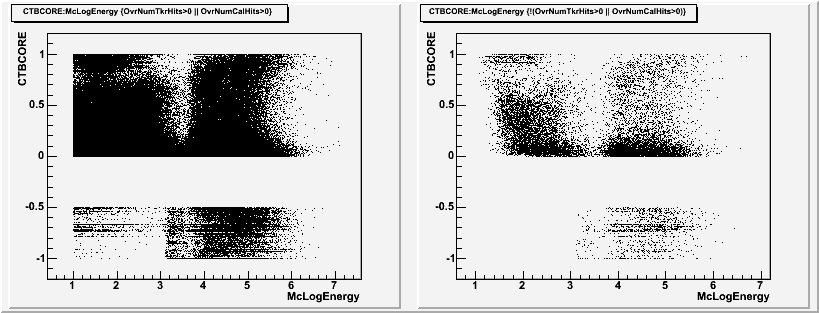
- Top right: McEnergy vs CTBCORE for overlays: note e.g. the corner at CTBCORE=0 and McLogEnergy=1
- Bottom left: same for no-overlays: the events in the corner are missing, these are the events that show up in the CTBCORE distributions
- Bottom right: CTBCORE distrib. for events with McLogEnergy>2.3 to cut low energy events
A more direct check: what is the difference for v17r16 events when overlays do not hit either cal or tkr? Compare newx plot on the right with bottom left in plot above.
Next, a look at the Psf CTB analysis to see what happens in detail to these events
