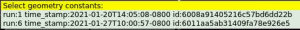
Page History
Mask Editor GUI is intended to manually create/edit mask of the bad pixels and save it as 2-d image and 3-d array shaped as data like array.
Content
Table of Contents
Main window GUI
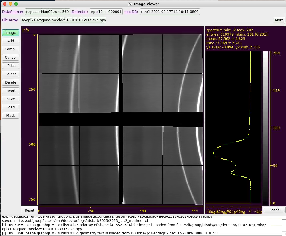
Image with axes
Spectrum with statistical data
Color bar selection
Logger

Control fields and buttons

Select DB parameters
Select detector
ROI control buttons
Launch Mask Editor
Mask Editor GUI can be launched in lcls2 software release (>ps-4.6.0) by command
masked
with(out) optional parameters as explained in help
masked -h
| Code Block | ||||
|---|---|---|---|---|
| ||||
ps-4.6.0 [dubrovin@sdflogin002:~/LCLS/con-lcls2/lcls2]$ masked -h
usage: Usage:
  masked -a <fname-nda.npy> -k <DataSource-kwargs> -d <detector> -g <fname-geometry.txt> [-L <logging-mode>] [...]

Help:
  masked -h

Examples:
  masked  # set all parameters using GUI
  masked -d epix10ka_000001                          # takes geometry from detector DB
  masked -d epix10ka_000001 -k exp=ueddaq02,run=569  # takes geometry from experiment DB
  masked -g /sdf/group/lcls/ds/ana/detector/data2_test/geometry/geo-epix10kaquad-tstx00117.data  # takes geometry from file
  masked -a /sdf/group/lcls/ds/ana/detector/data2_test/misc/epix10kaquad-meclv2518-0101-CeO2-ave.npy  # takes array for image from file
  masked -a /sdf/group/lcls/ds/ana/detector/data2_test/misc/epix10kaquad-meclv2518-0101-CeO2-ave.npy -g /sdf/group/lcls/ds/ana/detector/data2_test/geometry/geo-epix10kaquad-tstx00117.data
  masked -d epix10ka_000001 -a /sdf/group/lcls/ds/ana/detector/data2_test/misc/epix10kaquad-meclv2518-0101-CeO2-ave.npy
  masked -d epix10ka_000001 -k exp=ueddaq02,run=569 -a /sdf/group/lcls/ds/ana/detector/data2_test/misc/epix10kaquad-meclv2518-0101-CeO2-ave.npy

masked - command opens mask editor GUI

positional arguments:
  posargs               list of positional arguments: [<fname-nda.npy>] [<fname-geometry.txt>], default = []

optional arguments:
  -h, --help            show this help message and exit
  -a NDAFNAME, --ndafname NDAFNAME
                        image array file name*.nda, default = Select
  -d DETNAME, --detname DETNAME
                        detector name, default = Select
  -k DSKWARGS, --dskwargs DSKWARGS
                        string of comma-separated (no spaces) simple parameters for DataSource(**kwargs), ex: exp=<expname>,run=<runs>,dir=<xtc-dir>, ..., or <fname.xtc> or
                        files=<fname.xtc> or pythonic dict of generic kwargs, e.g.: "{'exp':'tmoc00318', 'run':[10,11,12], 'dir':'/a/b/c/xtc'}", default = Select
  -g GEOFNAME, --geofname GEOFNAME
                        geometry description constants file name *.txt, *.data, default = Select
  -L LOGMODE, --logmode LOGMODE
                        logging mode, one of CRITICAL, FATAL, ERROR, WARN, WARNING, INFO, DEBUG, NOTSET, default = INFO
  -o DIRREPO, --dirrepo DIRREPO
                        repository for files, default = ./repo-masked
  --ctab CTAB           color table index in range [1,8], default = 3
  --dirmode DIRMODE     directory access mode, default = 0o2775
  --filemode FILEMODE   file access mode, default = 0o664
  --group GROUP         group ownership for all files, default = ps-users
  --savelog             On/Off saving log file, default = 1
|
Mask Editor GUI main window
Mask Editor main window consists of sub-panels listed in this section with brief description of their functionality.
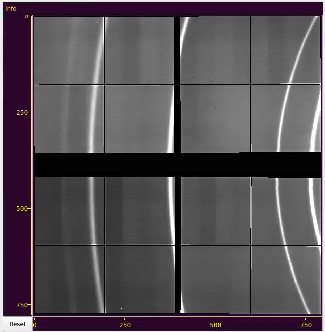
Image with axes and cursor info panel
Image nested in center of the main window.
Displays assembled image of the detector or stack of panels if geometry constants are not available. Click and drag or scroll mouse on image to translate or zoom-in/out desired part of the image. At mouse release spectrum will be updated. for visible part of the image. The same operation on axis works for appropriate transformation of its dimension, changing aspect ratio.
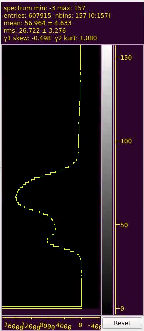
Spectrum with statistical data
Spectral widget is displayed on the right side of the image.
It shows spectral histogram of the visible part of the image, color bar, two axes, and statistical panel on the top.
Click and drag or scroll mouse on spectrum to select its part projected on color map on image. The same works for vertical axis. Horizontal scale does the same things for histogram scale. At mouse release image will be updated.
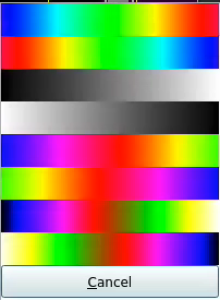
Color bar selection
Color bar maps intensity values to color map used on image. There are eight pre-defined color maps currently available.
To change color map - click on color bar and select color map/bar from pop-up window. The color bar and Image will be updated after selection is done.
Logger
Most important info messages are displayed in the logger window located in the bottom part of the main window. By default it has low profile, but can be expanded by mouse using expansion mark on the top boarder of the logger window.
Control panel
Control panel with multiple fields allows to set imaging array and geometry constants from DB or files.
Select DB parameters
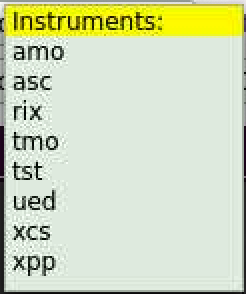
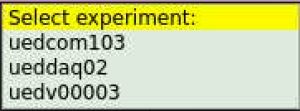
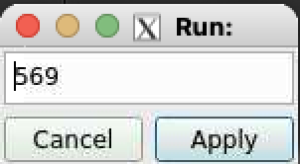
After click on the button next to DataSource: label a bunch of sequentially pop-up windows for instrument, experiment, and run number allows to set DB parameters. To terminate selection - click on highlighted-yellow title.
Select detector
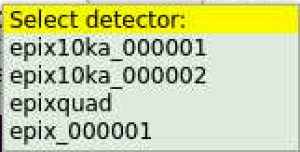
After click on the button next to Detector: label pop-up menu window allows to select detector from specified DB
If geometry is available for specified DataSource and Detector the field next to geo DB will be filled out automatically.
If many geometry constants available for specified detector, click on button next to geo DB: label and select desired constants from pop-up menu window.
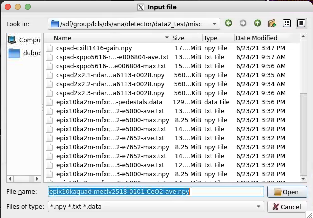
Select files
Use standard dialog to select I/O files
More fields
Switching button More/Less shows more or less control field between default and advanced modes. It adds fields to load geometry constants from file (button next to label geo:) and array (button next to label array DB:) for image from DB constants.
ROI control buttons
Control buttons for ROI are stacked in menu on the left side of the main window. Their functionality is described below.
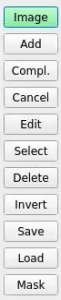
Translate and zoom image
Click on Image mode button, then click and drag or scroll mouse for translation or zomming zooming image, respectively. At release mouse button spectrum will be updated for visible part of the image.
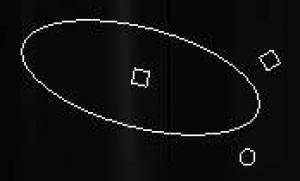
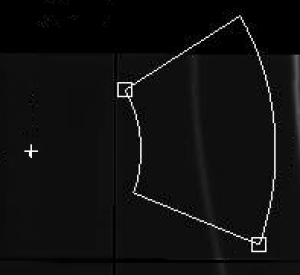
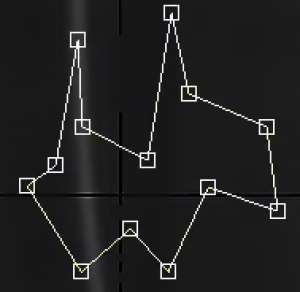
Add ROI
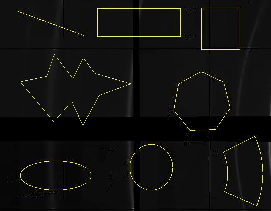
Click on Add button and select ROI type from pop-up menu:
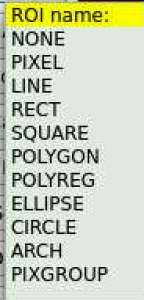
Available shapes of ROIs are self-explaining in this pop-up menu.
Adding ROI
Right after selected ROI type click on image to mark ROI control point locations as manyy many times as it is necessary to define particular ROI shape.
Add/
...
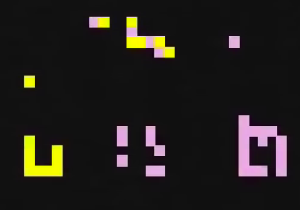
Remove PIXEL and PIXGROUP
Right after click on Add button and selection of PIXEL or PIXGROUP ROI, start clickiing clicking on desired pixels or click-hold-and-pan. Added pixels will be marked by color. Double click remove removes appropriate pixel. Input of the PIXGROUP is compleated
Edit mode


Select file GUI
Use standard dialog to select I/O files
compleated by the click on Compl.(ete) button.
Button Cancel
Button Cancel cancels adding of non-compleated ROI if it is not too late...
Button Compl.
Button Compl. completes adding of ROI with multi-point definition like PIXGROUP and POLYGON.
Select and Delete ROIs
Currently Select mode is used in combination with Delete in order to preview deleting ROI.
Click on Select button, then on ROIs to select. Selected items will change color.
PIXEL type ROI will be selected one-by-one. PIXGROUP ROI will be selected as whole by a single click.
Invert bad pixel region
Click on button Invert then select ROIs to invert region of good/bad pixels. By default internal region of each ROI is marked as bad pixels. Operation Invert inverts this definition.
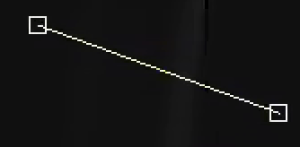
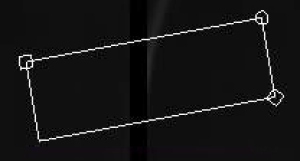
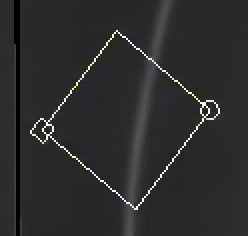
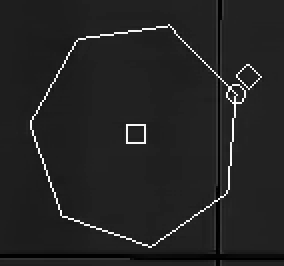
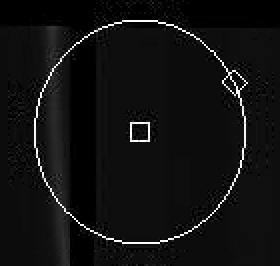
Edit mode
Click on Edit button, then on ROIs to edit. Selected for edition ROI changes color and shows control handle. Then, click and pan control handles to translate, resize or rotate ROIs.
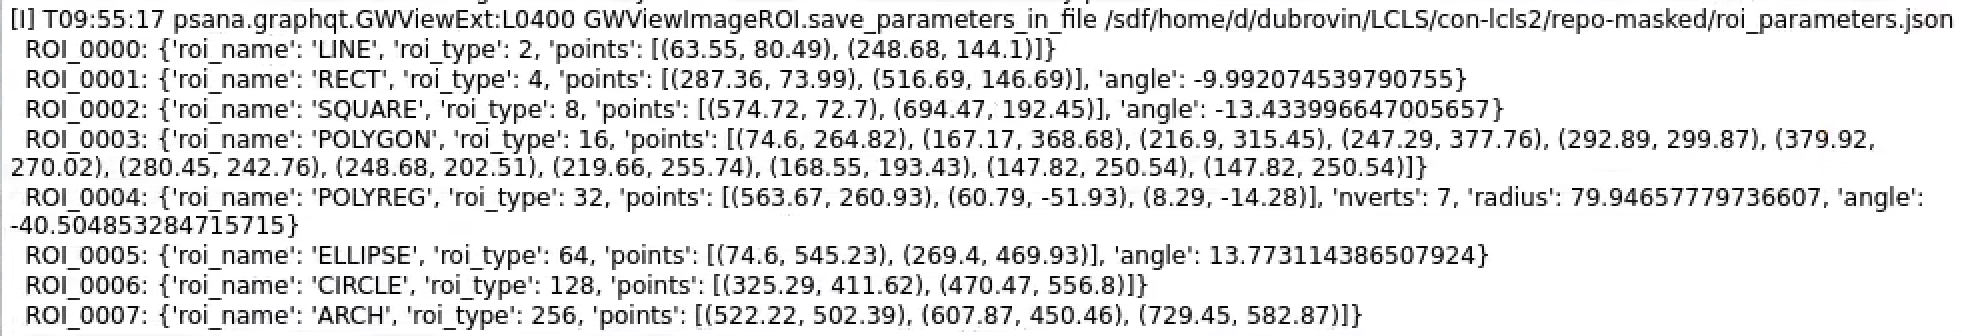
Save/restore ROI constants
Current ROIs parameters can be saved in json file by clicking on Save button and selecting output file name
Button Load loads constants from json file and draws ROIs on image.
Mask
Button Mask creates mask for drawn ROIs and save it in files for 2-d image (with suffix "-2d") and 3-d array (for panels like in data).
References
- Mask Editor - for LCLS(1)
- Mask Editor Development Notes
- Detector Calibration Constants Deployment
- Detector geometry constants deployment
- Bad Pixel Status
- LCLS-II Calibration DB
- Private Calibration Constants
- cdb - CLI for management of calibration DB
- calibman
- Calibration Scripts Repository and Logging
...
Overview
Content Tools