...
Map of counties and a map of regions see https://en.wikipedia.org/wiki/List_of_regions_of_Californiaa
California Counties
...
Covid-
...
19 San Francisco Bay Area confirmed cases and deaths
| Include Page | ||||
|---|---|---|---|---|
|
California Covid-19 for coastal counties from San Mateo southwards
| Include Page | ||||
|---|---|---|---|---|
|
California Sierra-Nevada counties
| Include Page | ||||
|---|---|---|---|---|
|
California June 2020
bubbles sized by population density for CA Counties and colored by per capita income (Jan 25, 2020 - Apr 30, 2020)
...
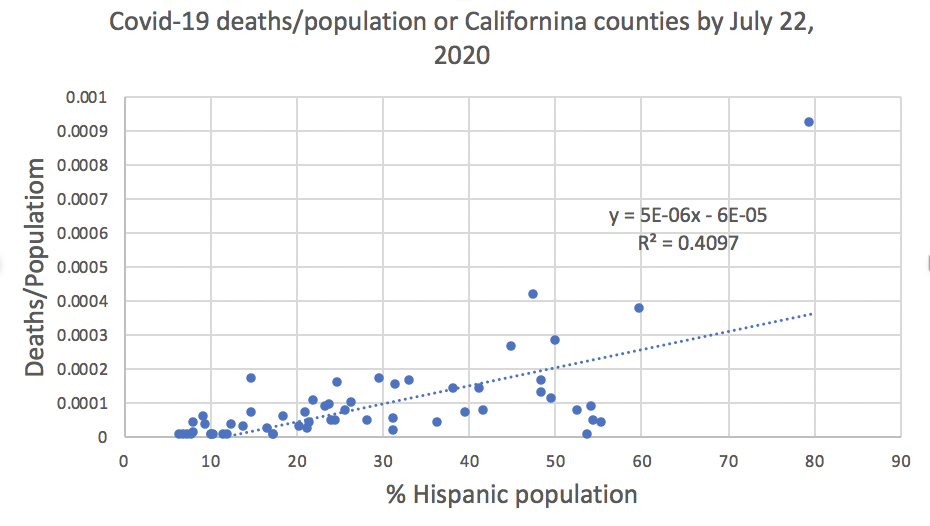
- Imperial county with a population of 177K had 8606 cases and 163 deaths, this compares with El Dorado county with a population of 181K that had 443 cases and 0 deaths. One big difference is the % Hispanic population: 79.6% for Imperial county and 11.8% for El Dorado county.
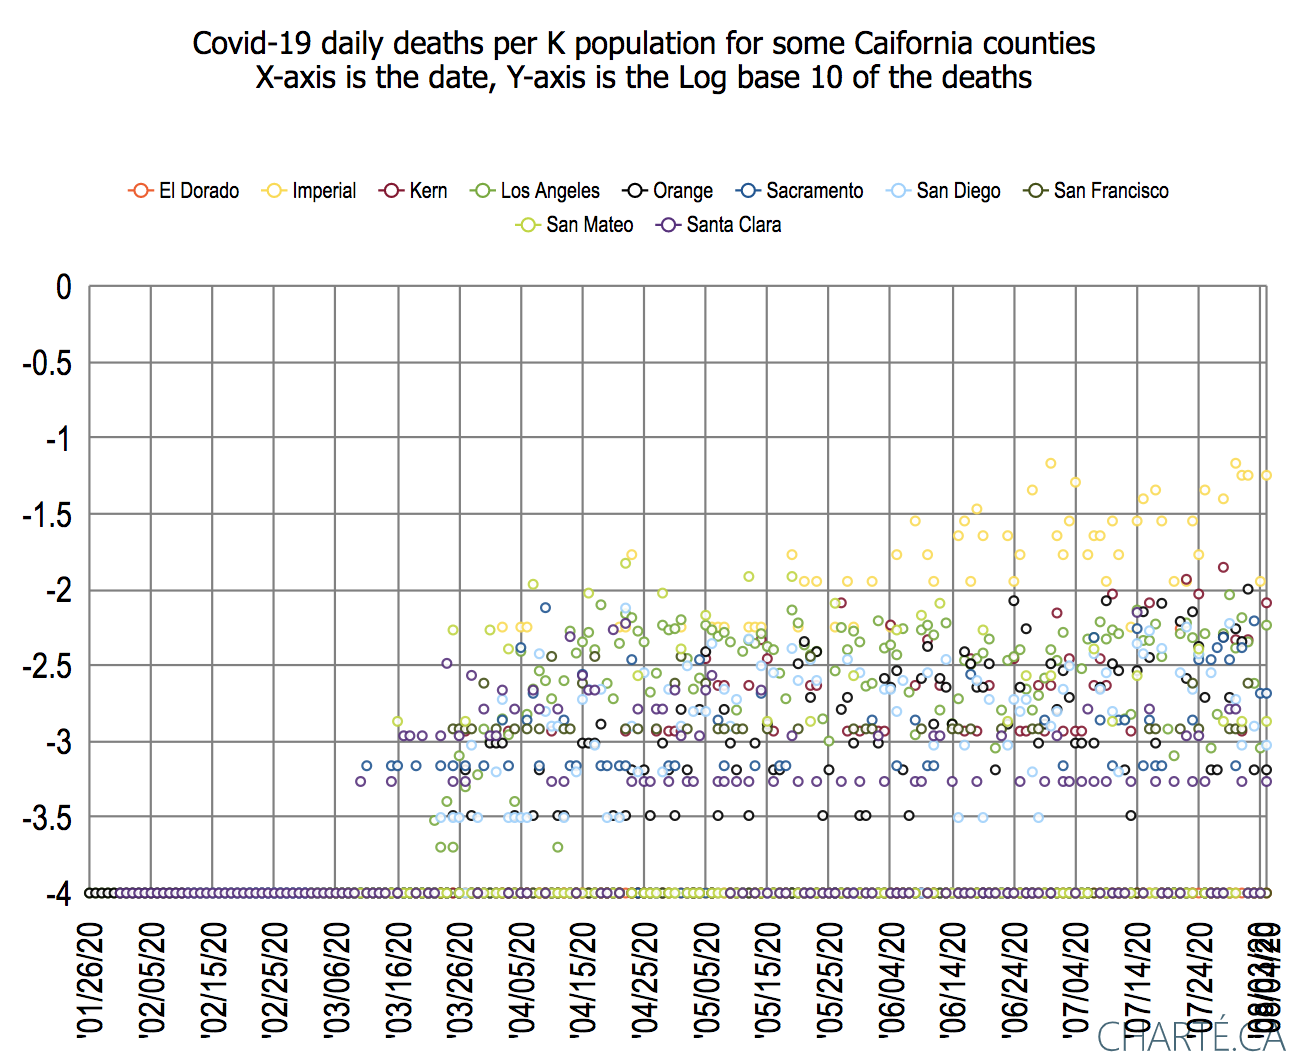
The following chart shows the daily confirmed cases per thousand population for a selection of California counties. The predominance of the Imperial (79.6% Hispanic)View file name covid19-california-confirmed-time-series.svgheight 250 
The following were the leading counties in terms of deaths/population
County ID Confirmed Deaths Population Deaths/population % Hispanic population Riverside RIV 29983 588 2266899 0.000259 45% KIngs KIN 3398 42 151390 0.000277 50.2% Tulare TUL 6896 167 451108 0.000370 59.8% Los Angeles LA 159045 4104 9974203 0.000411 47.5% Imperial IMP 8606 163 177026 0.000921 79.6% It is seen that these leading counties also had large Hispanic populations. Graphs of the ratios confirmed cases/population and deaths/population against the percent of Hispanic population in each California county are shown below, There are seen to be noticeable correlations (R2). The probability of a confirmed case is seen to be two to three times for counties with twice the percentage of Hispanic populations.

Given the "High Mortality from COVID-19 among Asian Americans in San Francisco and California" reported in https://asianarch.org/press_releases/Asian%20COVID-19%20Mortality%20Final.pdf, one would expect to find a strong correlation of deaths/population vs % Asian-American population for California counties. The labels on the charts below are the abbreviations for some of the counties (from https://sv08data.dot.ca.gov/contractcost/map.html).

The following were the leading counties in terms of deaths/confirmed cases:
County ID Deaths/confirmed % Population % Hispanic population Inyo INY 2.5 18439 18.7% San Mateo SM 2.5 739837 24.9% Los Angeles LA 2.58 9974203 47.5% Mariposa MPA 2.63 17946 9.4% Yolo YOL 2.84 204162 29.8% Shasta SHA 2.89 178520 8.3% Top ten California Counties by confirmed cases 7/26/2020
County ID Population() confirmed/Pop deaths/Pop Pop-Density(pop/sq-km) Hispanic% Imperial IMP 177026 0.051218 0.001022 42.385 79.6 Kings KIN 151390 0.025187 0.00031 108.959 50.2 Tulare TUL 451108 0.0182 0.000372 93.509 59.8 Marin MRN 256802 0.018006 0.000214 493.556 14.9 Los Angeles LA 9974203 0.017447 0.000437 2457.984 47.5 Kern KER 857730 0.017081 0.000143 105.477 48.5 Lassen LAS 33356 0.016639 0 7.345 17.4 Stanislaus STA 522794 0.015037 0.000166 349.735 41.3 Riverside RIV 2266899 0.014763 0.000281 314.564 45 San Joaquin SJ 701050 0.014444 0.000157 503.874 38.3 Ten California counties with the least confirmed cases/population 7/26/2020
County ID Population() confirmed/Pop deaths/Pop Pop-Density(pop/sq-km) Hispanic% Trinity TRI 13515 0.000222 0 4.251 6.7 Sierra SIE 3019 0.000331 0 3.167 7.5 Siskiyou SIS 44261 0.001378 0 7.05 10.2 Plumas PLU 19286 0.001452 0 7.554 8 Humboldt HUM 134876 0.00152 0.00003 37.802 9.6 Shasta SHA 178520 0.00163 0.000045 47.285 8.3 Alpine ALP 1202 0.001664 0 1.628 7 Amador AMA 37159 0.002045 0 62.496 12.2 Inyo INY 18439 0.002169 0.000054 1.811 18.7 Calaveras CAL 44921 0.002204 0.000022 44.04 10.2 California Confirmed cases / day and deaths / day:


The ratio of deaths/confirmed was about 2.5% mid April but had dropped to about 1.4% as of 7/26/2020. This may be related to the introduction of more effective treatments for the coronavirus over the past five months and the fact that hospitals are better prepared to handle patients (see https://www.sfchronicle.com/health/article/Why-coronavirus-cases-are-rising-but-deaths-are-15384724.php).
California (e.g. see https://www.cdph.ca.gov/Programs/CID/DCDC/Pages/COVID-19/CountyMonitoringDataStep1.aspx) uses a 14-day case rate to determine if it has exceeded some limit (100 per 100,000 population) for each county to determine what activities should be shut down for that county.
For California counties, the average number of days from the first recorded confirmed case to the first recorded death was 84+-39 days.
- Imperial county with a population of 177K had 8606 cases and 163 deaths, this compares with El Dorado county with a population of 181K that had 443 cases and 0 deaths. One big difference is the % Hispanic population: 79.6% for Imperial county and 11.8% for El Dorado county.


...