...
The raw data we analyze is the Johns Hopkins University daily confirmed cases data for the US available at: https://raw.githubusercontent.com/CSSEGISandData/COVID-19/master/csse_covid_19_data/csse_covid_19_time_series/time_series_covid19_confirmed_US.csv
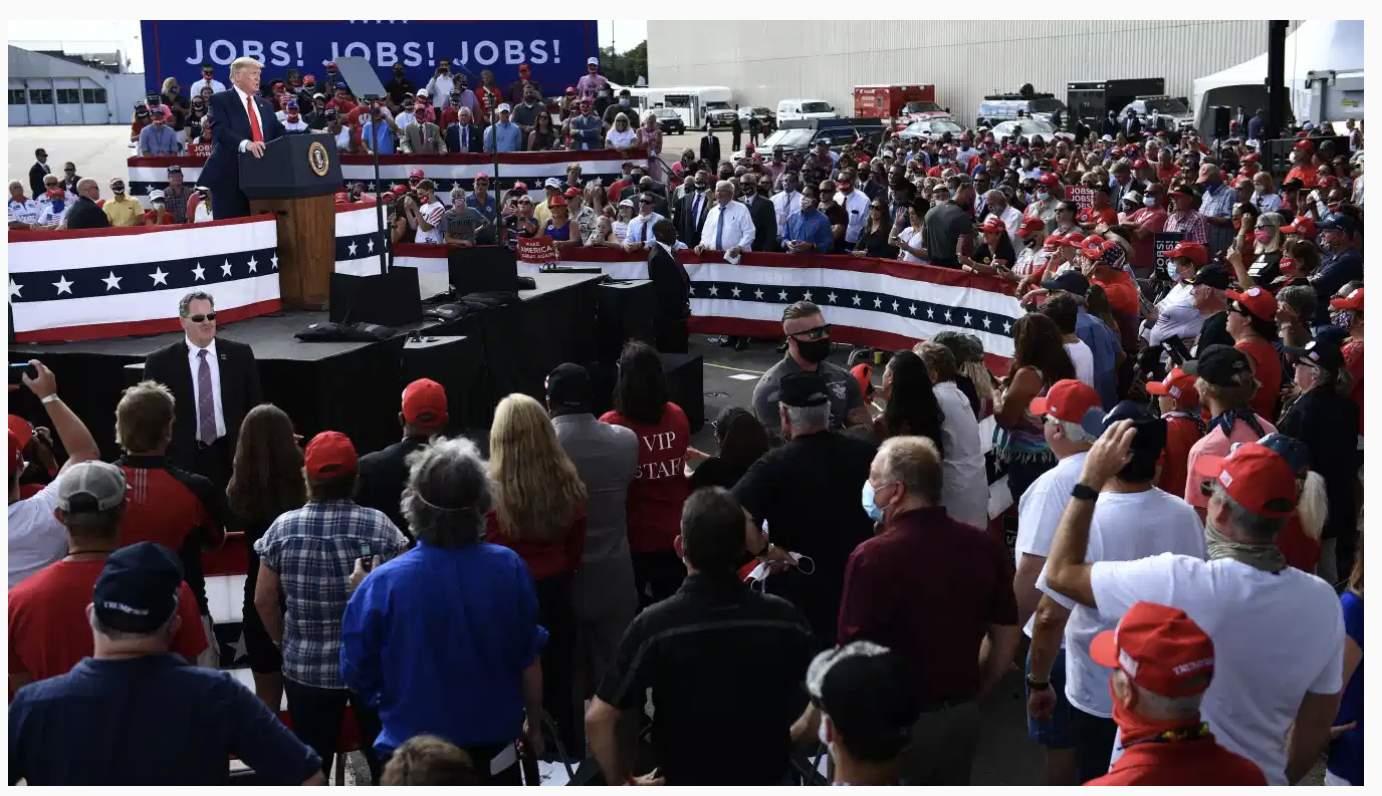
The social distancing at the rallies was minimal, and not everyone wore maks, see the photos below taken at the Oshkosh rally.

We just look at the number of daily confirmed cases for the county in which the event was held. Thus we do not include cases from surrounding counties etc.
...
The smoothed daily confirmed cases indicated marked increases in the cases as follows
County State date of event date of noticeable increase in cases magnitude of increase delay peak Blue Earth Minnesota 8/17/2020 8/27/2020 3x increase in cases/day 10 days 9/03/2020 Lackawanna Pennsylvania 8/20/2020 8/29/2020 3x increase in cases/day 9 days 9/04/2020 Rockingham New Hampshire 8/28/2020 9/10/2020 2x increase in cases/day 13 days Not yet Winnebago Wisconsin 8/17/2020 8/28/2020 2.5x increase in cases/day 11 days Not yet Westmoreland Pennsylvania 9/3/2020 9/12/2020 The sharp rise in Winnebago from about 10 confirmed cases/day to following the Trump rally to over 60 new cases reported on 8/17/2020 is a concern.