Log in
Skip to sidebar
Skip to main content
Linked Applications
Loading…
Spaces
Hit enter to search
Help
Online Help
Keyboard Shortcuts
Feed Builder
What’s new
Available Gadgets
About Confluence
Log in
Internet End-to-End Performance Monitoring
Pages
Blog
Child pages
Covid-19 - Visualizing the data with Motion Charts
Covid-19 - Visualizing California data
Covid-19 California coastal counties from San Mateo southwards
Covid-19 California Sierra Nevada counties
Covid-19 San Francisco Bay Area
Browse pages
Configure
Space tools
View Page
Page History
Page Information
View in Hierarchy
View Source
Export to PDF
Pages
…
Home
Projects
PingER
PingER Case Studies
PingER and COVID-19
Covid-19 - Visualizing the data with Motion Charts
Covid-19 - Visualizing California data
Page History
Versions Compared
Old Version
41
changes.mady.by.user
Les Cottrell
Saved on
Aug 13, 2020
compared with
New Version
42
changes.mady.by.user
Les Cottrell
Saved on
Aug 13, 2020
Previous Change: Difference between versions 40 and 41
Next Change: Difference between versions 42 and 43
View Page History
Key
This line was added.
This line was removed.
Formatting was changed.
...
Bay Area counties % daily deaths/confirmed cases 8/10/20
Bay Area Cumulative deaths
per million population
Image Removed
Image Added
Daily San Francisco Bay Area daily confirmed cases / Million population (linear y axis)
Daily San Francisco Bay Area daily confirmed cases per Million population (log10 y axis)
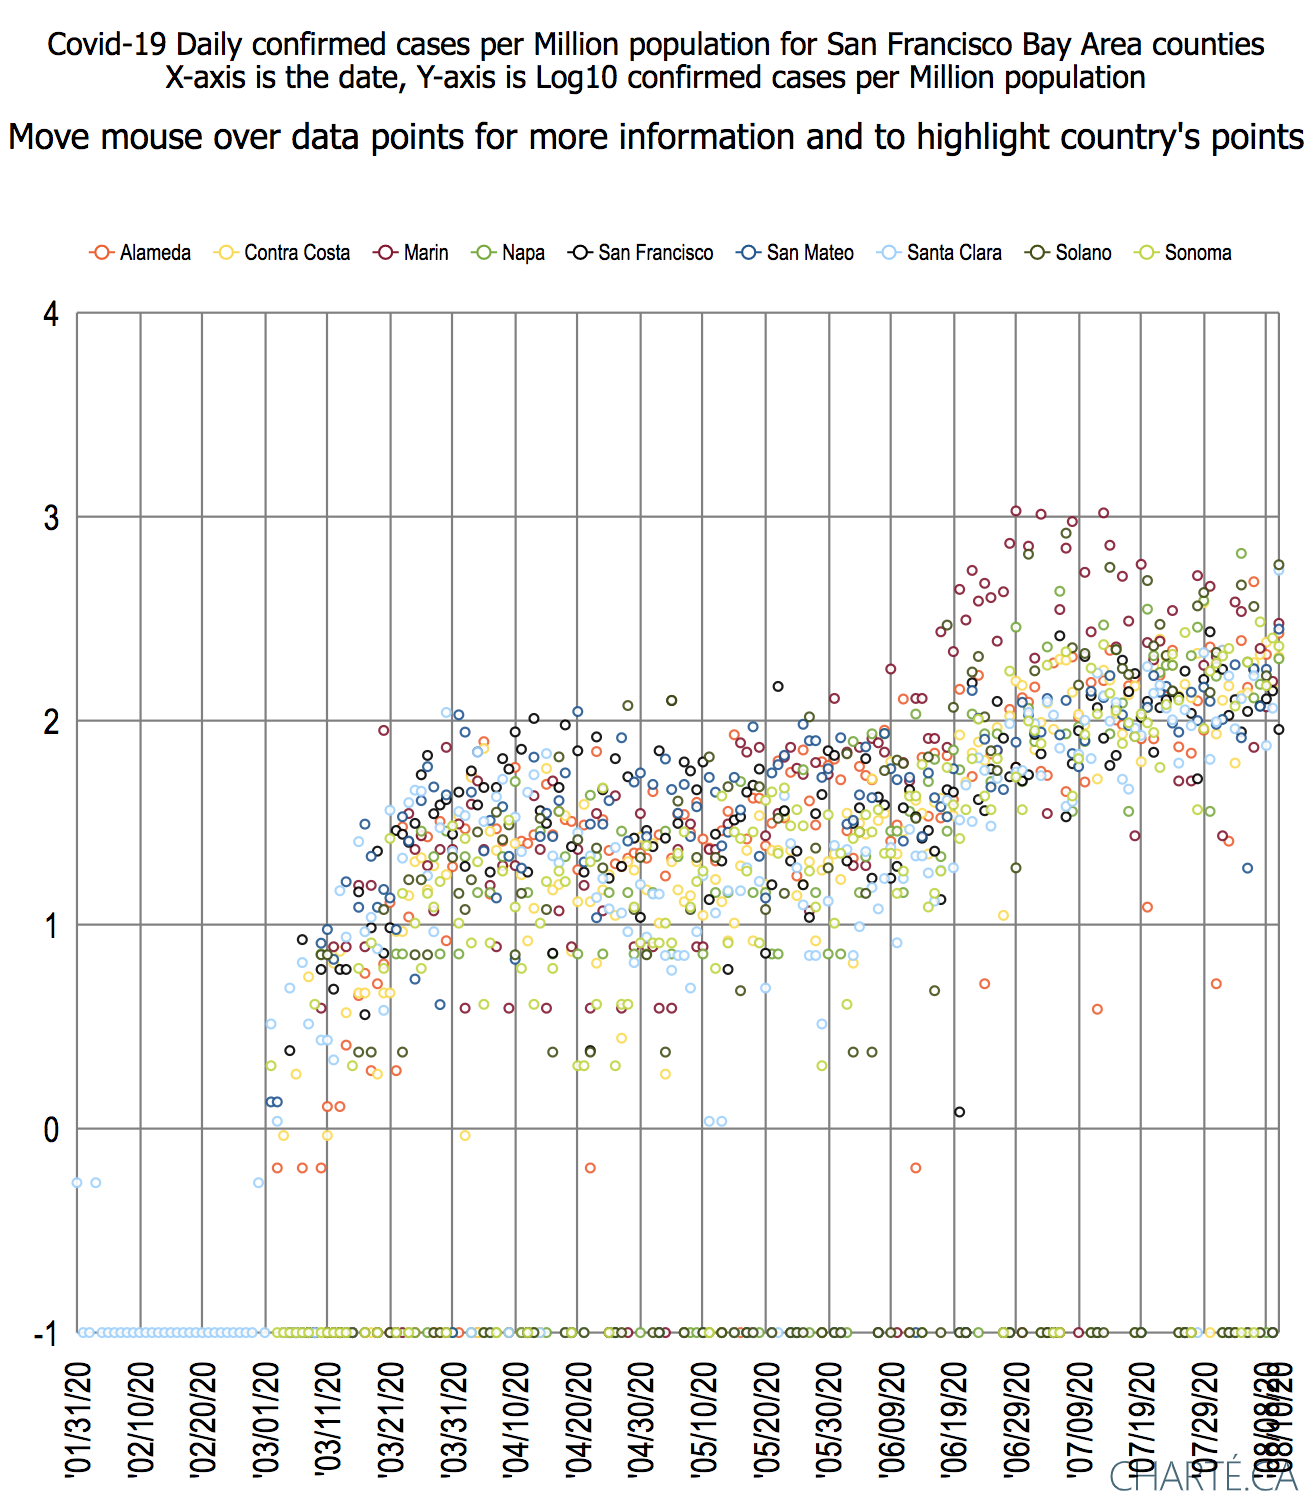
...
Overview
Content Tools
{"serverDuration": 101, "requestCorrelationId": "280ebf5b632b2469"}