...
California by County every 5 days colored by per capita income | Californa by county every 5 days colored by % Hispanic in county Low<0-33.4%, medium>=33.4%-<37.8%, high>= 37.8% |
|---|---|
 |  |
Observations:
...
- Imperial county with a population of 177K had 8606 cases and 163 deaths, this compares with El Dorado county with a population of 181K that had 443 cases and 0 deaths.
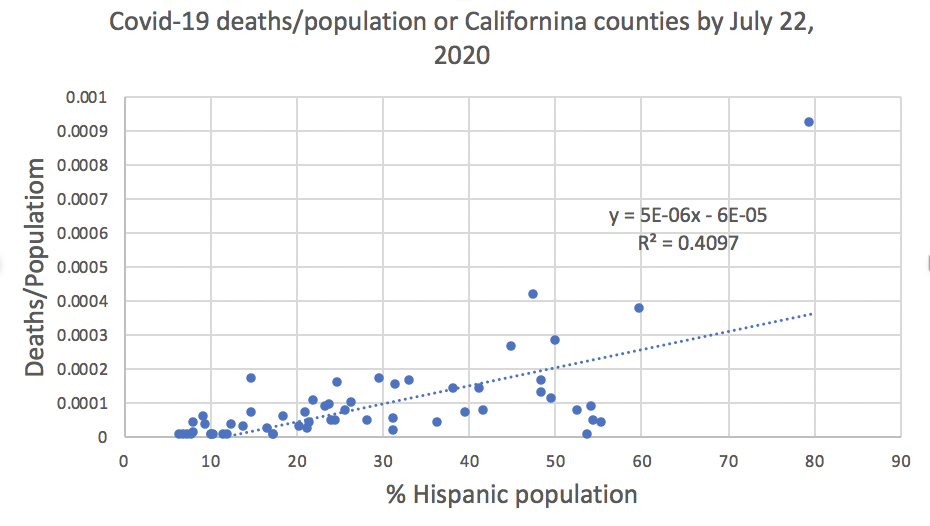
The following were the leading counties in terms of deaths/population
County ID Confirmed Deaths Population Deaths/population % Hispanic population Riverside RIV 29983 588 2266899 0.000259 45% KIngs KIN 3398 42 151390 0.000277 50.2% Tulare TUL 6896 167 451108 0.000370 59.8% Los Angeles LA 159045 4104 9974203 0.000411 47.5% Imperial IMP 8606 163 177026 0.000921 79.6% It is seen that these leading counties also had large Hispanic populations. A graph of ratio Graphs of the ratios confirmed cases/population and deaths/population against the per cent of Hispanic population in each California county is shown areshown below, There is are seen to be a noticeable correlation correlations (R^2=0.41).

The following were the leading counties in terms of deaths/confirmed cases:
County ID Deaths/confirmed % Population % Hispanic population Inyo INY 2.5 18439 18.7% San Mateo SM 2.5 739837 24.9% Los Angeles LA 2.58 9974203 47.5% Mariposa MPA 2.63 17946 9.4% Yolo YOL 2.84 204162 29.8% Shasta SHA 2.89 178520 8.3%