...
| County | ID | Covid-19 confirmed | deaths | Population() | %Hispanic Population |
| Alpine | ALP | 2 | 0 | 1202 | 7% |
| Amador | AMA | 57 | 0 | 37159 | 12.2% |
| Calaveras | CAL | 87 | 0 | 44921 | 10.2% |
| Colusa | COL | 223 | 0 | 21424 | 53.8% |
| El Dorado | ED | 443 | 0 | 181465 | 11.8% |
| Lassen | LAS | 512 | 0 | 33356 | 17.4% |
| Plumas | PLU | 24 | 0 | 19286 | 8% |
| Sierra | SIE | 22 | 0 | 3019 | 7.5% |
| Siskiyou | SIS | 50 | 0 | 44261 | 10.2% |
| Trinity | TRI | 104 | 0 | 13515 | 6.7% |
| Tuolumne | TUO | 101 | 0 | 54347 | 10.5% |
- Imperial county with a population of 177K had 8606 cases and 163 deaths, this compares with El Dorado county with a population of 181K that had 443 cases and 0 deaths.
The following were the leading counties in terms of deaths/population
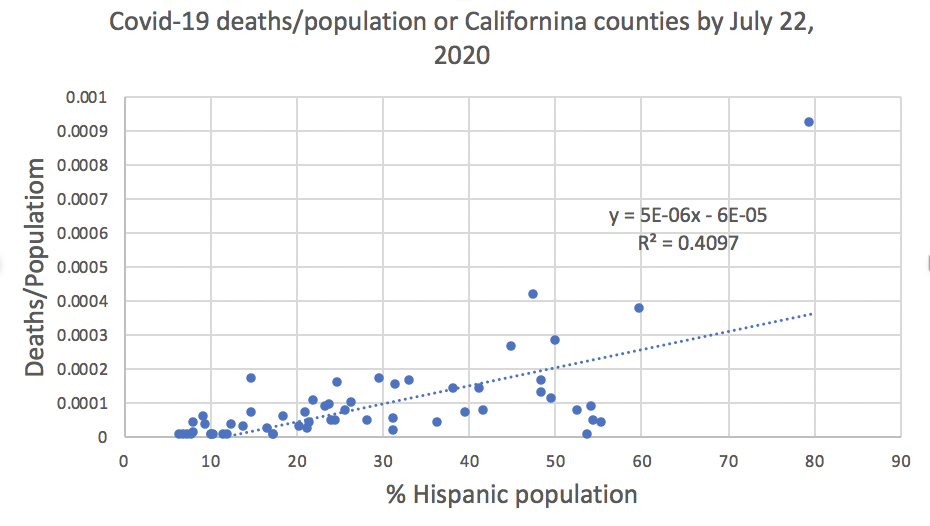
County ID Confirmed Deaths Population Deaths/population % Hispanic population MonoRiverside MNORIV 91829983 6588 141932266899 0.0004000259 45% OrangeKIngs ORAKIN 682743398 121242 3086331151390 0.0004000277 50.2% Tulare TUL 6896 167 451108 0.000370 59. 00048% Los Angeles LA 159045 4104 9974203 0.000411 47. 00045% Imperial IMP 8606 163 177026 0.0009000921 Nevada NEV 37058 655 98606 0.0066 Lake LAK 39192 887 64209 0.013879.6% It is seen that these leading counties also had large Hispanic populations. A graph of ratio deaths/population against the per cent of Hispanic population in each California county is shown below, There is seen to be a correlation.
The following were the leading counties in terms of deaths/confirmed cases:
County ID Deaths/confirmed % Population % Hispanic population Inyo INY 2.5 18439 18.7% San Mateo SM 2.5 739837 Humboldt HUM 2.56 13487624.9% Los Angeles LA 2.58 9974203 47.5% Mariposa MPA 2.63 17946 9.4% Yolo YOL 2.84 204162 29.8% Shasta SHA 2.89 178520 8.3%