Introduction
To facilitate the analysis and presentation of the PingER data by others we made the historical hourly data available via anonymous FTP.
- The initial audiences were:
- Chin Fang for part of the Zettar demonstration of file transfer at the Super Computing 2014
- Renan Souza, Maria Campos and her team at UFRJ for the PingER Linked Open data project.
- Ibrahim Abaker of UM for his Big Data project
- The hourly data was chosen rather than the raw data since it is cleaner having been through several filters.
- The hourly data is in: /nfs/slac/g/net/pinger/pingerreports/hep/<metric>/ directory with the file name <metric>
<size><by><yyyy><mm>-<dd>.txt.gz
- The hourly data is in: /nfs/slac/g/net/pinger/pingerreports/hep/<metric>/ directory with the file name <metric>
The raw (daily gathered data from all the monitoring hosts) is close to 400GBytes. This includes:
- /nfs/slac/g/net/pinger/pinger_mon_data/ping-<YYYY>-<MM>.txt (15GB) SLAC measurements
- /nfs/slac/g/net/pinger/pinger2/data/ping-<YYYY>-<MM>.txt (8GB) SLAC measurements
- /nfs/slac/g/net/pinger/pingerdata/ (375GB) data gathered at SLAC
- We ignore these data in the rest of this web page.
- /nfs/slac/g/net/pinger/pinger_mon_data/ping-<YYYY>-<MM>.txt (15GB) SLAC measurements
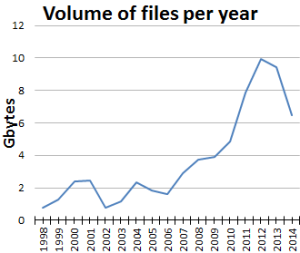
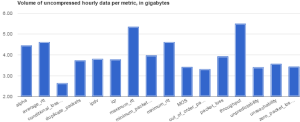
Volume of data
There are roughly 100,000 files. The volumes of the files are shown below.
| Uncompressed Volume of files per Year for all metrics | Uncompressed Volume for 3 metrics | Volume of uncompressed data by metric |
|---|---|---|
 |  |  |
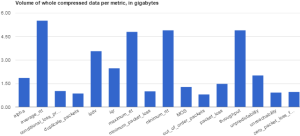
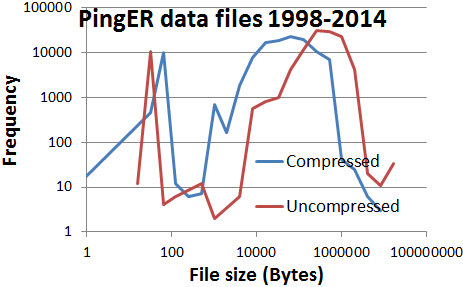
Compression
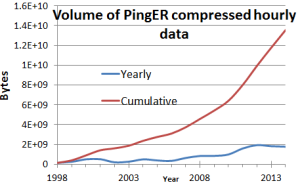
If I multiply the file size times the frequency to get the bytes in each bin, and then sum I get 11,566,219,714 Bytes from compressed and 58,434,764,384 from uncompressed. This is ~ a compression ratio of 5:1. The graph below also shows that Uncompressed files are larger than compressed.
| Volume of compressed data by metric | Frequency of files by size from compressed & uncompressed data | Cumulative & yearly compressed data volumes |
|---|---|---|
 |  |  |
Missing data
There are two types of missing data:
- Given the number of days, number of metrics we expect 6209 files in a year. However typically some files are missing (e.g. data may not have been gathered that day, the gathering host may have been down, the data may have been corrupted etc.)
- The monitoring host may not have been working or the host being monitored may not have responded to the pings. In this case since there is no value for the metric for the monitoring-remote host pair, then a dot is recorded.
| Missing files/year by metric | Total number of dots per year | Dots per metric |
|---|---|---|
 |  |  |
Spreadsheets
Hourly file data analysis from Renan and Christiane, see also
https://docs.google.com/spreadsheets/d/1357xGkpYFeW0DcnDB-i7ZER2RBhjdQHEbmMDOvdc7bA/edit?usp=sharing