
To facilitate the analysis and presentation of the PingER data by others we made the historical hourly data available via anonymous FTP.
The raw (daily gathered data from all the monitoring hosts) is close to 400GBytes. This includes:
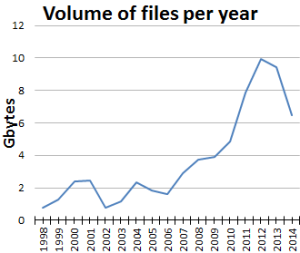
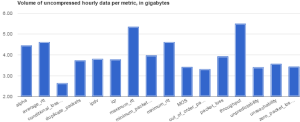
There are roughly 100,000 files. The volumes of the files are shown below.
| Uncompressed Volume of files per Year for all metrics | Uncompressed Volume for 3 metrics | Volume of uncompressed data by metric |
|---|---|---|
 |  |  |
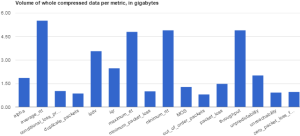
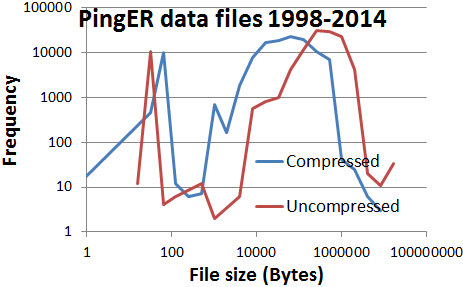
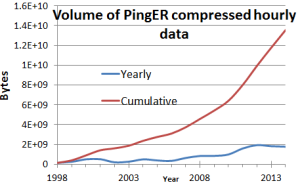
If I multiply the file size times the frequency to get the bytes in each bin, and then sum I get 11,566,219,714 Bytes from compressed and 58,434,764,384 from uncompressed. This is ~ a compression ratio of 5:1. The graph below also shows that Uncompressed files are larger than compressed.
| Volume of compressed data by metric | Frequency of files by size from compressed & uncompressed data | Cumulative & yearly compressed data volumes |
|---|---|---|
 |  |  |
Missing data
There are two types of missing data:
| Missing files/year by metric | Total number of dots per year | Dots per metric |
|---|---|---|
 |  |  |
Hourly file data analysis from Renan and Christiane, see also
https://docs.google.com/spreadsheets/d/1357xGkpYFeW0DcnDB-i7ZER2RBhjdQHEbmMDOvdc7bA/edit?usp=sharing