| Fig 1 | Fig 2 |
|---|---|
|
|
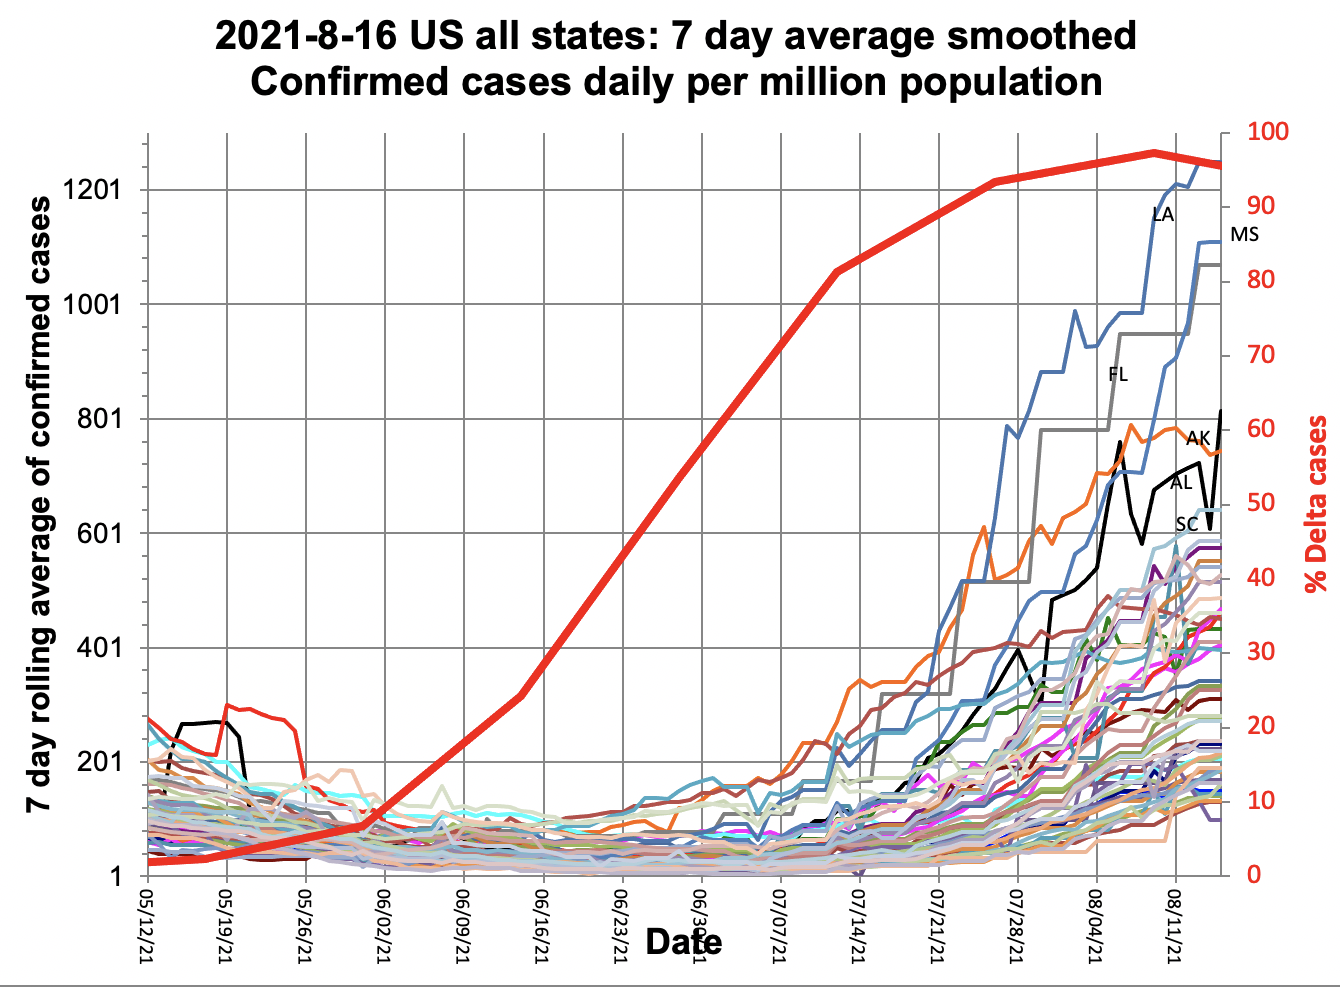
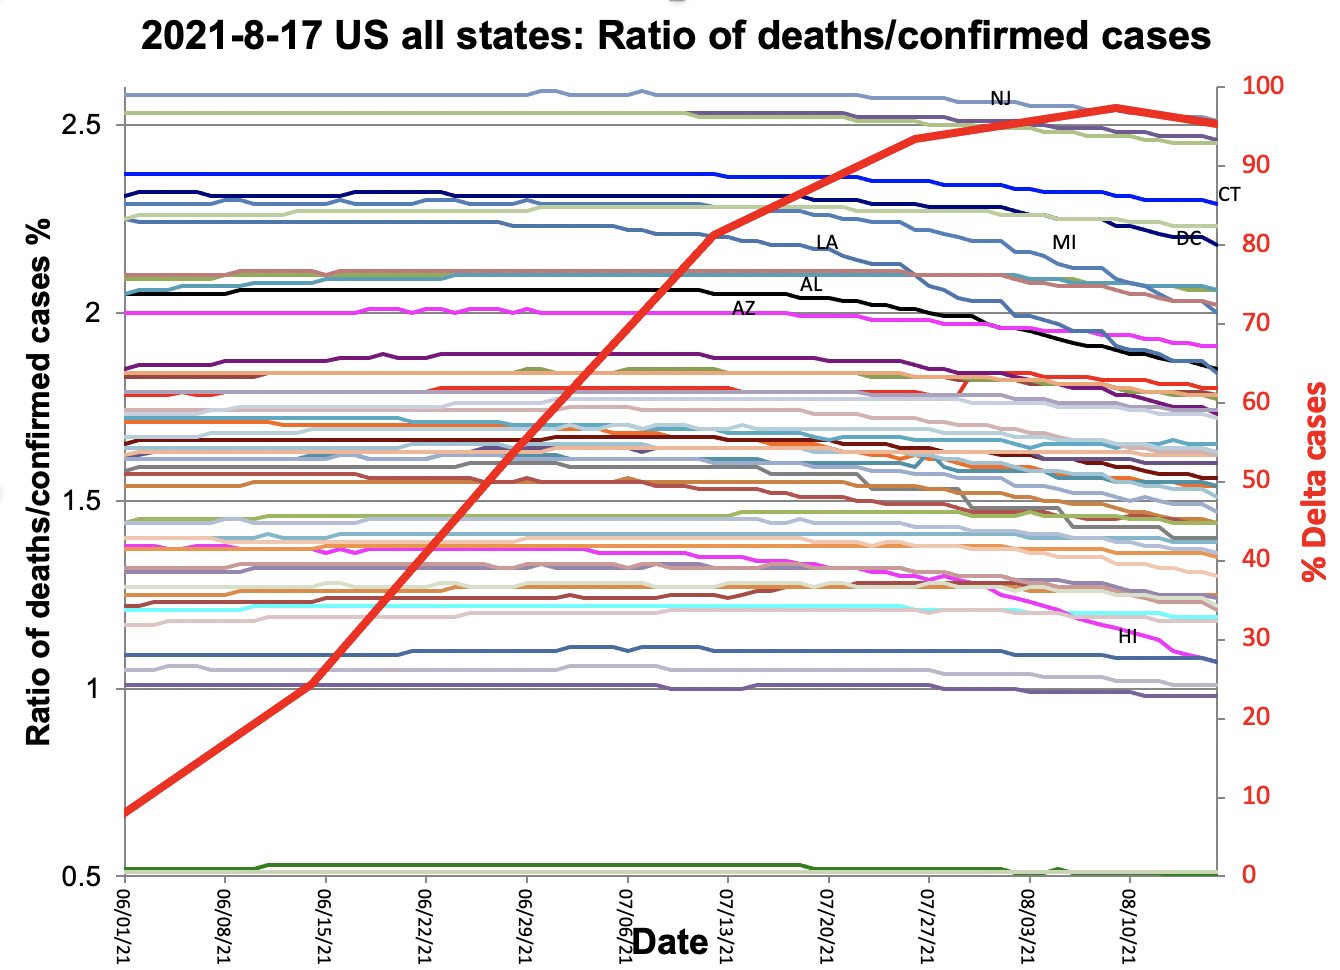
Fig 1
- Indicates the confirmed COVID-19 daily cases noticeably started to increase around the 3rd week in June 2021.
- At this time the delta variant was about 50%
- By August 17, 2021, the leading states in terms of daily cases were Louisianna, Mississippi, Florida, Arkansas, Alabama, and South Carolina
Fig 2 shows the ratio of deaths/confirmed cases, it is seen that
- As the % deltas variant passed 60% there is a noticeable decrease in the ratio, more specifically by 8/16/2021 for :
- Hawaii decreased by -22.5%, Louisianna -18.3%, Michigan -12.6%, Oklahoma -8.7%, Michigan -8.28%, and South Carolina by -7.93%.
- On the other hand, Maine increased by 2.46%, Wisconsin by 0.85%, Michigan by 0.49%, and Montana, South Dakota, Utah, and Minnesota had a 0% change.
- The average change in the ratio was 4.71%
+-4.6
Thus there is evidence that the delta variant does not kill as large a proportion of those it infects as do the previous variants.
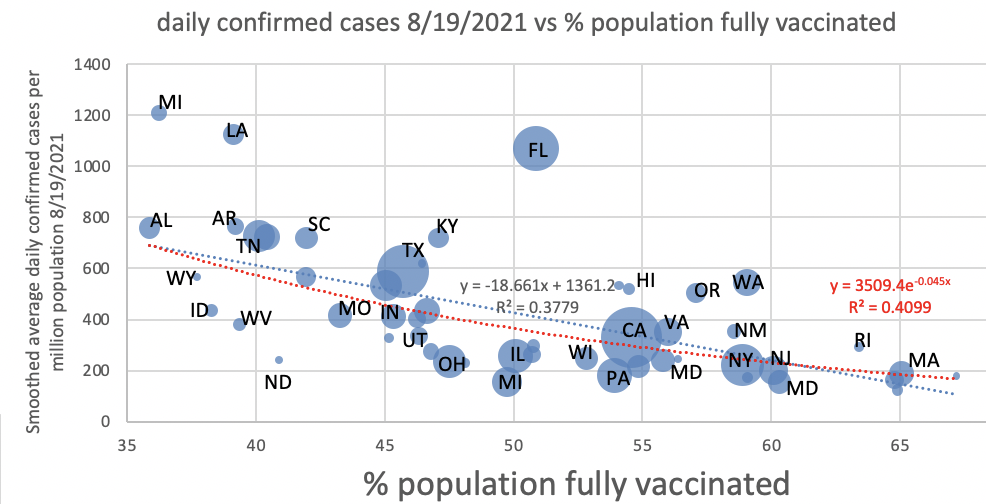
Fig 3 shows the daily confirmed cases on 8/19/2021 vs % population vaccinated for the US states. With the exception of Florida it is seen that the states (Mississippi, Lousiana, Alabama, and Arkansas) with the lower % of people fully vaccinated have the higher confirmed cases.
Fig 3 | |
|---|---|
|