From the study of Data/MC signal ratios in beam test runs Philippe concluded that all calorimeter crystals have uncorrected nonlinearity in the energy range between 10 MeV and 200 MeV, so that the ratio of the reconstructed energy to the true energy increases from 1.00 to 1.12 when energy increases from 10 MeV to 200 MeV. Above this energy the Data/MC ratio shows very slow decrease. Philippe suggested to correct this residual nonlinearity in CU crystals by simple function and eventually apply the same correction to LAT reconstruction as well.
To verify if this correction should be applied to LAT I tried to measure the residual nonlinearity in LEX1 by looking at the HEX8/LEX1 ratio and considering that HEX8 range is linear because from charge injection measurement the non-linearity in HEX8 is by order of magnitude smaller than in LEX1.
The following plot shows the correlation between HEX8 and LEX1 energies between 2 and 1000 MeV. Energy depositions from all 3072 crystal end are plotted on the same histogram. Red points represent the raw adc values multiplyed by linear calibration coefficients (used normally by onboard software) i.e without any correction of nonlinearity. Blue points represents reconstructed energies at each crystal end, i.e. using nonlinearuty correction by the function measured by charge injection calibration.
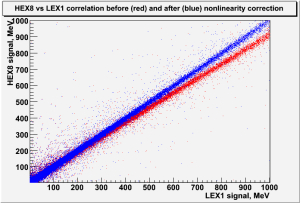
One can see that non-linearity correction is up to 10 % and definitely inproves the situation. Without correction LEX1 energy would be ~10% bigger than HEX8 energy at the end of the range.
Unfortunately, due to significant noise in HEX8 range (~6 MeV sigma) we cannot use this method to study nonlinearity below 3*sig ~ 20 MeV, as profile will be biased by LAC threshold. But we can make profile plot of HEX8/LEX1 ratio for energies between 30 MeV and 1000 MeV in log scale. Please note that this plot shows inversed quantity with respect to Philippe's plot of residual nonlinearity, becasue I use HEX8/LEX1 ratio, so if LEX1 is overestimated, then the ratio on my plot would be less than 1.
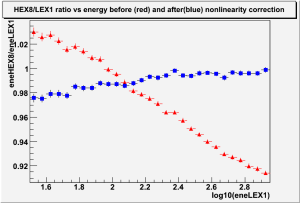
Red points shows the HEX8/LEX1 ratio without nonlinearity correction, blue points - after standard nonlinearity correction with charge injection spline used actualy in reconstruction.
One can see that after nonlinearity correction the nonlinearity (difference in ratio between 30 MeV and 1000 MeV) decreases from 12% to 2% and changes sign, so we've overcorrected the real nonlinearity.
The residual nonlinearity, representad by blue points have the shape similar to Philippe's curve for CU (change of slope at ~200 MeV), but smaller amplitude and opposite direction
So, I confirm that the effect similar to one seen by Philippe in CU, exist in LAT, but it has different amplitude and direction, so it should be measured and corrected independently from beam test data.
But for calibration unit the correction proposed by Philippe could be applied and should be implemented in reconstruction.
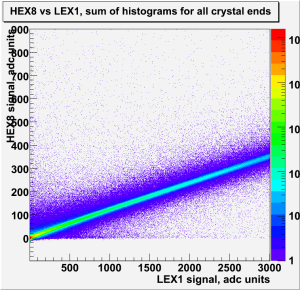
Nonlinearity in HEX8 vs LEX1 correlation in ADC units
To study nonlinearity down to low energies ~10 MeV comparable to HEX8 noise it is necessary to properly average this noise. This is possible when using ADC units rather than reconstructed energy (or DAC values) because ADC values below pedestal are kept. The folowing plot shows 2d histogram of HEX8 vs LEX1 adc signals for all crystal ends and all events of one on-orbit nomSciOps run (244425100), the only selection is gemDeltaEventTime > 100 us.
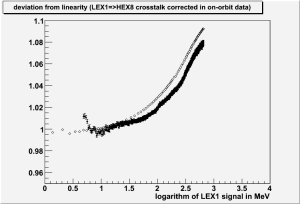
To study the deviation from linearity each vertical slice of this 2d histogram was fitted with gaussian and the peak value of HEX8 signal used to find LEX1/HEX8 ratio for this bin. Then all this ratios were normalized to the value corresponding to LEX1 signal 10 MeV ( ~33 LEX1 units). The following plot shows this normalized LEX1/HEX8 ratio versus logarithm of LEX1 signal in MeV (black points). Curve with open circles shows the deviation from linearity obtained by charge injection calibration and used for nonlinearity correction.
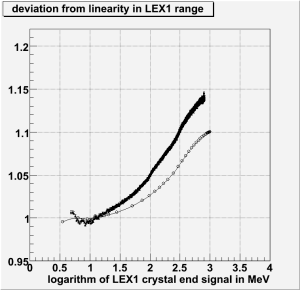
One can see that at high signals (300-1000 MeV) the deviation from linearity measured by real events is ~5% bigger than one measured by charge injection.
Update on residual nonlinearity
There is is a contradiction noticed between the plot 2 and plot 4 above: plot 2 shows that when applying standard nonlinearity correction the result is "overcorrected", while plot 4 shows that raw nonlinearity in charge injection curve is smaller than in on-orbit data.
In fact, the plot 4 was made considering that HEX8 range in perfectly linear. I tried to verify this statment using charge injection calibration with "fine" step (calibGain=OFF).
Next plot shows the nonlinearity in HEX8 range (average of all 3072 CAL crystal ends): 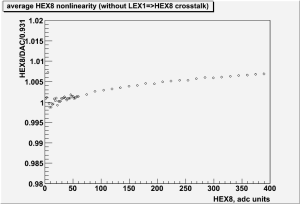
One can see that the nonlinearity is less than 0.5 % in the signal range used for LEX1-HEX* intercalibration. But this data obtained by pulsing only HE diode - so this doesn't take into account LEX1=>HEX8 crosstalk.
This crosstalk is measured in another charge injection run and show on the next plot.
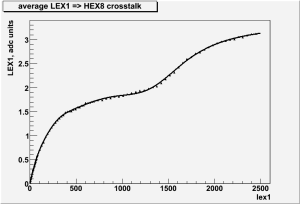
The effect of this crosstalk is substancial for very low signals. To account for it I subtracted this crosstalk from on-orbit data (as the plot give xtalk in HEX8 adc vs LEX1 adc I can do it directly.
The comparison of the nonlinearity in on-orbit data and charg injection after this correction is shown on the next plot