It's the first Friday of the month, which means the Weekly Cal Trending Plots are available for your viewing pleasure.
Also, today is the birthday of Jay-Z ... I guess that pretty much sums things up.
It's the first Friday of the month, which means again we have the monthly news report regarding the Weekly Cal Trending Plots.
And on this day in history, in 1872, Susan B. Anthony attempted to vote for Grant.
It's the first Friday of the month, and that means that it's time to take a look at the weekly Calorimeter Trending Plots.
Also, on this day in history, Peanuts premiered in 1950 in 8 newspapers.
It's the first Friday of the month, and that means that it's time to take a look at the weekly Calorimeter Trending Plots.
Also, on this day in history (1998) - Google files for incorporation in California, further underscoring the importance of visiting the Calorimeter Trending Plots ... or at least giving a moderately better reason for reading this news item.
The calorimeter trending plots are available for viewing. These plots are generated weekly, but I am adding a news item for the first set generated of each month.
The latest plots are available here
The trending plots for July 02 have been posted. Plots are posted weekly, but announcements will be released for the first set of each month.
Calorimeter trending plots
Averaged Values (in MJD) from David Sanchez
LAC pos thresholds: 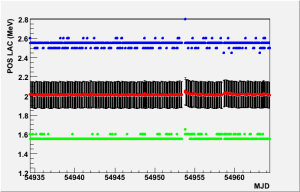
LAC neg thresholds: 
FLE thresholds: 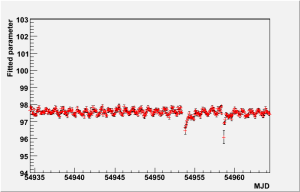
FHE thresholds: 
Mean Pedestal Deviations - LEX8: 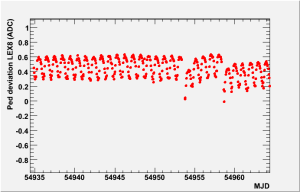
Mean Pedestal Deviations - LEX1: 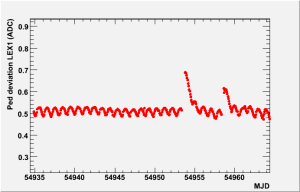
Mean Pedestal Deviations - HEX8: 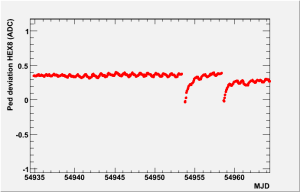
Mean Pedestal Deviations - HEX1: 
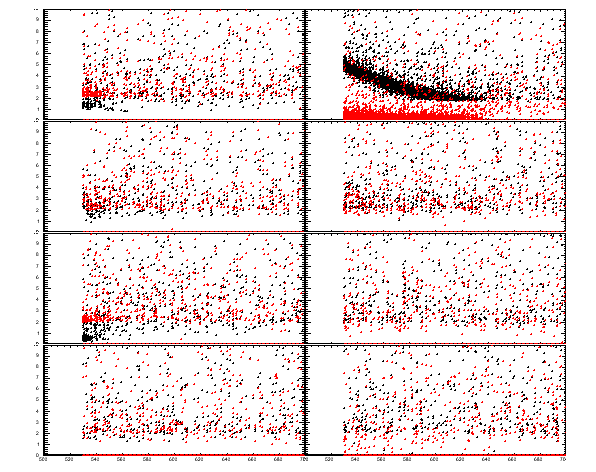
The CAL channels concerned by this belong to columns 5,6 and 7
XtalEnergy vs GemDeltaEventTime histograms for the 3 columns:
column 6
example: tower 8
An ASCII list in the format (tower,layer,column) of channels having the noise:
Pedestals trending
The results of CAL pedestals calibration in LEX8 and HEX8 ranges for the first 44 runs collected on orbit showed a significant bias with respect to the pedestals actually used for the data processing in the pipeline (they were measured during cold thermal balance period of Observatory TVAC in January 2008).
The plot below shows the trending of pedestal difference with respect to official pre-launch pedestal file for all LEX8 channels over 44 runs:

Similar plot for all HEX8 channels:
The reason for this pedestal drift is higher temperature on orbit with respect to cold_TVAC. Pedestals for the first 12 runs demonstrate some evolution, while CAL temperature was increasing and after that became stable. The maximum pedestal drift is 30 adc units, which corresponds to 1 MeV in LEX8 range and 60 MeV in HEX8 range. It is not very big bias for energy measuremet, but it strongly affects the position measurement along the crystal as the 1% bias of the signal at one crystal end leads to the 5 mm bias in position. This effect is the biggest in HEX8 range starting at 1 GeV, so 60 MeV bias means 6% leading to 3 cm position bias.
To avoid these consequences we request to replace the existing pedestal file with the new one:
/nfs/slac/g/svac/chehtman/calibGenCAL_analysis/flight/ped/calPed_28jun08.xml
produced genMuonPed application of calibGenCAL package revision calibGenCAL-05-06-00 from calibOps run 236323982 collected on Jun 28,2008.
Validation of new pedestal file
Anders Borgland has reprocessed 10K events from the run 236323982. The following plot shows the sum of pedestal histograms for all LEX8 channels.
The sigma of the distribution 5.4 adc units matchs exactly the width of individual pedestal (see red histogram below).
This means that we have completely corrected the channel to channel spread of pedestal drift, show on the next plot and having the RMS=2 adc units. Without correcting of this spread the sigma of hped histogram would be 7.5 adc units.
The same logic could be applied to the next three plots showing the new pedestal verification for HEX8 range.

Conclusion: new pedestal file corrects the pedestal drift with respect to existing calibration and should replace it.